Scanning for stocks Day trades and Swing Trades
I have had a couple people ask me how I scan for stocks to add to my watch lists.There are a couple important factors in day trading to have a successful trade. One very important one is liquidity or number of shares that are being bought and sold. If you get into a stock and there isn’t enough liquidity when you want to sell your position depending on the size of it you might drop the stock price on your exit.
So to find a stock that has good liquidity. I will usually do my morning gap scans with more than 100,000 shares changing hands and more than 100 trades for the premarket. I also look at the stocks from the previous day on market view with Equityfeed. I look at the stocks that had the biggest gap down and up for yesterday and premarket today.
Typically the stocks that have had big movements from the day before and that morning are good to trade because the bigger movements come with news of some sort to drive the price action. I tend to be someone that will trade a stock that is reversing so if it is overextended in the buying side or the selling side. There is what seems to be a rubber band effect once the price goes above or below the Bollinger Bands (BB) on 1 min chart. Also the RSI or relative strength index above 70 can indicate overbought and below 30 to indicate oversold.
For my day trades I use the BB and RSI together to time my entries looking at primarily the 1 minute chart. You have heard me refer to my three greens for going long in which I look at 3 charts for the same stock of 1,2 and 5 min charts and I would look for all three charts to show green candles. You probably won’t enter and the bottom but it tends to be a fairly good indicator of the momentum shifting. It can sometimes just indicate a bounce and fake you out.
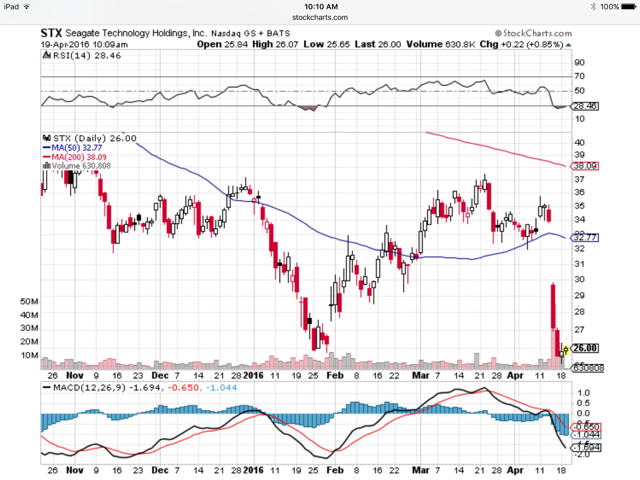
For my longer swing trades I will look more at the price action of a stock over a year or longer time frame. I posted the STX stock chart as an example of why I entered the trade. This stock looks to have set up a double bottom and is ready for a bounce or upward movement like it reversed in February. When you look at the chart over a year or in this case 3 years you can see the RSI for the daily chart is below 30 a typical indication of overselling. My swing trades I use more of my value trading history to reason the trade in that this stock has good value to it as one of the S&P 500 stocks and one of two major producers for hard disk drives. The press has been the driving factor in the selloffs/shorting that we have seen. Same thing happened to TSLA that drove it down to 140 now it’s up in 240s. Once the momentum shifts people see that it is rising again they will jump back in and drive the price action up.
I hope this has helped you to understand how I scan for my stocks. As for finding them with scanners Inuse Equityfeed for the gapping stocks and sortability. You could use finviz.com or Yahoo biggest gainers if you can’t afford to pay. Intraday I use Trade Ideas for stocks that are in play. You can find links to all of them under the main menu page how to start daytrading.
I hope this week has been green for you so far. I’m having a great time with my family and having my daughter play with her cousins. I miss my trading desk, however these moments are priceless. I’m so thankful I took the time to study the market to make this work schedule freedom a possibility.
I always love hearing how I’ve helped you or questions you want answered. Leave a comment or shoot me a message on Instagram, Facebook or Twitter and I will answer to the best of my ability. I should also be having an upcoming interview from Jacob Whitish the guy that created the Digital Stock Summit and on my trip I just came up with a great book idea.
Have a great day, afternoon or night and know you can do it all too. Just take steps to change your reality into what you want it to be.
This blog is for information purposes I am not a registered securities broker-dealer or an investment advisor. The information here is not intended as securities brokerage, investment or as an offer or solicitation of an offer to sell or buy, or as an endorsement, recommendation or sponsorship of any company, security or fund.