When you first start in your trading career it can truly seem overwhelming. If you have never even looked at trading again then the chart wil seem like Greek. What on earth is going on with these charts. Well I will try to give you a cliff notes version here. If you want more in depth reading there are books dedicated to the subject at the bottom.
How to Read the Stock Charts
When you are looking at a stock chart the absolute basic is going to be the price vertically and the time horizontally. Above is an example of the daily chart for Apple
When you look at charts there are different time frame that you can look at to help you make your assessment.
Here you can see a 5 minute chart, 45 min chart, Daily Chart and a Weekly Chart. The charting package I am using here is Tradingview.com I absolutely love them as you can transfer your setup from desktop to the app on your handheld device of Apple or Android.
Why do you want to look at a chart on multiple time frames?
It is fairly easy to find an entry on one time frame, but you want to make sure that all of the time frames are showing you good reason to enter. If you see one that is showing a different direction you might want to be cautious knowing that you could be going along the trend.
All of the candlesticks are derived from the volume and price action over a time basis. The smaller the time frame the more erative the movement can be and could shake you out. The time frames tend to be better for scalping a move, but could trick you into getting out of a good trade by micro managing the trade.
Would you believe that sometimes I will look solely at the volume traded on a book map to know where the support and resistance lie for the day. I will also track the biggest buyers and sellers positions as well as where GSCO (Goldman Sachs) is on the book (level 2).
When I see the big guys moving their targets up or GSCO moving their sell up, I have noticed after time they continue to push the stock up to their targets. The same is true if I see the stock price drop and the buy targets dropping as well.
All of this will determine the trend, but does it correspond with the overall trendline?
What is the Trendline ?
Trendlines are a visual representation of support and resistance in any time frame. They show direction and speed of price, and also describe patterns during periods of price contraction. This is from Investopedia.com
Ok lets get into the visuals of trendlines now.
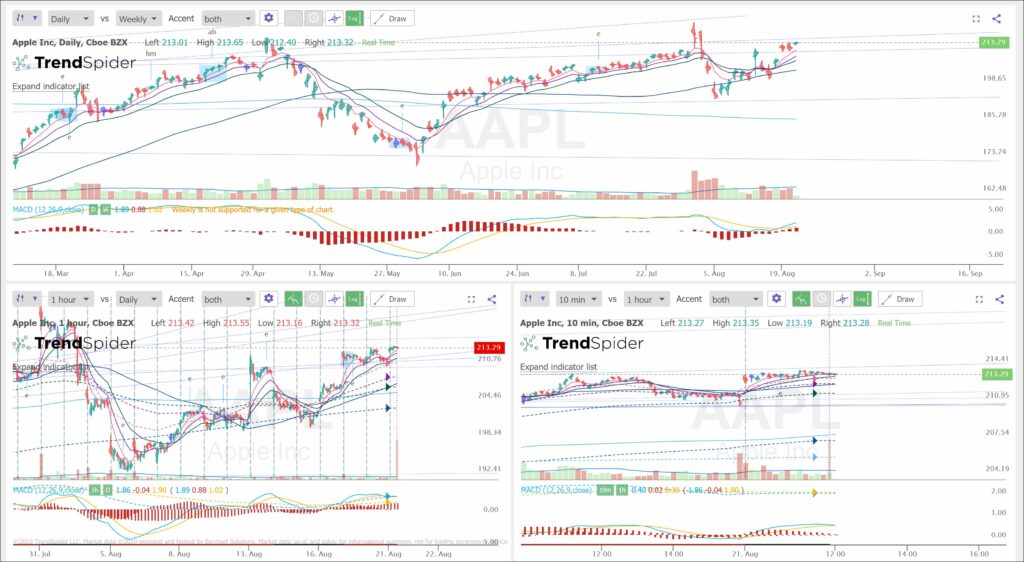
Here is an AAPL stock chart with the yellow trend lines from Trendspider.com You can see the trendlines that the algorithym has automatically drawn as potential spots of resistance and support.
When you have a trend line broken and volume behind it that is when the price action will tend to heat up. Many times shorts and computers will put their stops just above a trend line and the same is true that longs and algos going long will analyze and put a stop just below a trend line to act as support.
The cool thing about Trendspider is that you can overlay timeframes so you have multiple time frame analysis on one chart. So far this is the only software that I have seen that gives you the ability to do that without having to write your own custom script.
As you can see I also have moving averages on my chart and what is very cool is the multiple time fram analysis will also used the dashed lines for the higher timeframes for the moving averages as well. So I can see the trend lines from another time frame and also the moving averages.
There is not just one time frame that every trader or algo uses for trading so being aware of other walls of resistance or support to act as a hurdle is great profit taking and target setting.
Stock Market Prices Today
The stock market prices today are quite volatile with Trump, FOMC, Trade Wars and more. When you are prepared and have a plan trading becomes much easier. It can be black and white once you set aside your emotions and look at it in a scientific manner.
You must remember there is no rationality in the market and it will always be right. It is how you react to the price action of the market that will allow you to capture gains.
Top 5 books about stock charts
As of August 2019 I have partnered as an educator in The Training Pit that was created to help people learn from zero knowledge or to reset your training.
I hope this post has helped you learn a bit more about stocks and charting. As you can tell helping people is very fulfilling and the whole reason why this blog began in 2015. I will be sure to write more how to in the area to help you in your journey.
I love hearing feedback from you. It makes my trading more personal and I like to hear how I can help you. If you would like to be in Training Pit with me sign up here or if you want one on one training you can email me jane@thedarkpools.com You can contact me here or Twitter (@ItsAirplaneJane), Instagram (missairplanejane), LinkedIn and Facebook (@sugarairplanejane) or YouTube
The tool I use for scanning and alerting is Trade Ideas who offer an always free trading room. You can receive 5% off with Promo code CARPEPROFIT15 all caps when you sign up here for your first year or month
Trade Ideas will be offering the quarterly full access test drive of their software their software in Nov 2019 for the cost of data fees $9.
Another amazing software is Trendspider that has a new innovative rain drop candlestick that shows the volume for the morning session and afternoon session as far as the weight of it in price action. You can try them for free for 7 days here and receive 20% off with MTS20
This blog is for informational and educational purposes. I am not a registered securities broker-dealer or an investment adviser. The information here is not intended as securities brokerage, investment or as an offer or solicitation of an offer to sell or buy, or as an endorsement, recommendation or sponsorship of any security or fund.
If you are new to stocks it is really important to determine your goals up front. Are you looking to take control of your 401K retirement account? Do you want to quit your job?
Depending on what you goal is for your investments you might want to trade stocks or you might want to invest in stocks.
Day Trading vs Value Investing
So Day Trading is going to be a shorter term trading period where you are much more active in stocks day to day. You can intraday trade a trade which is buying or selling the same day.
If you hold a trade for more than one day say opening on Monday and then close it on Wednesday then you would be swing trading.
Now how does this differ from value investing? Value investing is going to be a longerterm approach of years. This is the buy it and hold it method which tends to be long biased over the years.
What is long biased? Well that is when you are expecting the stock to go up. Now why would you think that the stocks are going up in general.
Well many companies in the US offer retirement accounts that buy and hold these stocks longterm. So when the mutual funds are buying a stock what’s going to happen when they place a long order. You would expect it go up.
So now you know the simple difference between day trading versus value investing. Maybe you want to know some books that you can read to learn a bit more in depth.
Best Stock Market Books for Beginners
The classic book for someone that wants to be a day trader is Reminiscenses of a Stock Operator. That has classic terms and examples that are relevant even today.
When you are learning a sport you need to have a good coach. Brett Sternberger is a an amazing pyschologist and person and his words in The Daily Trading Coach have helped numerous traders evaluate themselves.
If you want to learn trade using the darkpool. The Dark Pool Secrets book has helped to change my trading by Stefanie Kammerman and as a result we are working together in the Training Pit teaching people to trade.
An amazing book for someone brand new to longer term trading is Michele Schneider’s book Plant your Money Tree where you learn about the market view and different sectors. You can review the market and how it could impact bigger decisions such as a career pic for your child in College.
Another Series of books that helps educate active day traders is Market Wizards series by Jack Schwager. The tips and techniques that experienced traders share in interviews.
An amazing book that is great for longer term investment trading is Brian Shannon’s Technical Analysis Using Multiple Timeframes Brian is amazing and his development of Anchor VWAP is an incredible tool that will blow your mind for longer term trading.
How to get into stock investing
So now that you know the differences between trading and investing what is the next step to investing.
You might have a 401k already which you could ask if it is possible to self direct. I am not a financial advisor, but you could ask them if you are not able to self direct it to transfer or roll it over to Fidelity.
Fidelity will allow you to trade in a 401K. There are likely other brokerages that are available out there if you ask.
You can also open a regular account with a broker, it does depend on where you are in the world with regulations which brokers you can use.
Stock Brokers For Beginners
If you are looking for a great broker that offers lots of tools an training, Think or Swim is great with all the tools they offer.
Interactive Brokers is a bit more of a technical broker, but they offer the best commisions at the time of writing this post. There software is a bit confusing and technical at first, but then you get the hang of it.
For the active day traders another great broker is CenterPoint securities. Center Point is really good for those that like to short stocks, especially the harder to find stocks with lower floats.
If you are someone that knows about trading options, which in my opinion you should learn after learning about trading stocks. Tasty Works is amazing for those in the US. Tom Sosnoff developed Think or Swim and sold it and later developed Tasty Works.
Again that comes back to your question of timeframe for holding the stock.
Are you looking for longer term timeframe? If you are potentially considering a longer term time frame with anticipation that you think the stock will go up a couple of pennies on your entry might not make a difference in the big picture.
If you are looking for shorter timeframe of day trading , then the entry and exit of your trades make a huge difference.
The best times of day for day trading tend to be after the chop of open has picked a direction for the day and the stock meets a criteria for entry whether long or short.
The best times to enter a swing trade tend to be in the last 15 min of the day. Simply little slogan.
It it ends strong go long and if it looks like it’s time to abort then go short.
I will cover what I mean by that slogan in another post.
It is also very important to manage your risk properly as well. The best thing to map out before you get into a trade is your entry and exit strategy.
Acting in haste and emotion will likely end up in a losing trade.
Ready to Start Learning
I have created a couple of online videos to help you in your journey. Ones that I wished were out when I started my day trading journey.
I have also partnered as an educator in The Training Pit that was created to help people learn from zero knowledge or to reset your training.
I hope this post has helped you learn a bit more about trading and investing. As you can tell helping people is very fulfilling and the whole reason why this blog began in 2015. I will be sure to write more how to in the area to help you in your journey.
I love hearing feedback from you. It makes my trading more personal and I like to hear how I can help you. If you would like to be in Training Pit with me sign up here or if you want one on one training you can email me jane@thedarkpools.com You can contact me here or Twitter (@ItsAirplaneJane), Instagram (missairplanejane), LinkedIn and Facebook (@sugarairplanejane) or YouTube
The tool I use for scanning and alerting is Trade Ideas who offer an always free trading room. You can receive 5% off with Promo code CARPEPROFIT15 all caps when you sign up here for your first year or month
Trade Ideas will be offering the quarterly full access test drive of their software their software in Nov 2019 for the cost of data fees $9.
Another amazing software is Trendspider that has a new innovative rain drop candlestick that shows the volume for the morning session and afternoon session as far as the weight of it in price action. You can try them for free for 7 days here and receive 20% off with MTS20
This blog is for informational and educational purposes. I am not a registered securities broker-dealer or an investment adviser. The information here is not intended as securities brokerage, investment or as an offer or solicitation of an offer to sell or buy, or as an endorsement, recommendation or sponsorship of any security or fund.
When it is earnings season day traders get excited. It increases the volatility in the market to open up more trading opportunities. The stocks that are reporting earnings before the open or reporting earnings after the close tend to always have more volume and activity.
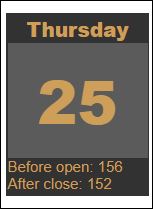
Today July 25th is in the earnings calendar one of the biggest days of the earnings season. I love EarningsWhispers.com for seeing the upcoming earnings in both calendar format and also individual breakdown with expected earnings results.
Here is today’s earnings Calendar. You can see this morning before the bell there were 156 companies reporting and 152 to report after the bell. Not only are there 152 reporting but some of the strongest stocks in the market such as AMZN, GOOGL, GOOG SBUX, INTC,
SPY ETF Holdings
These are part of the SPY and QQQ ETFs and when they have a big gap it can affect the market overall. To give you some idea of the strength that they have in affecting the market here is their weight in the ETFS.
$AMZN is 3.29% of the $SPY and 10.31% of the $QQQ
$GOOG is 1.39% of the $SPY and 4.17% of the $QQQ
$GOOGL is 1.36% of the $SPY and 3.67% of the $QQQ
$SBUX is 0.44% of the $SPY and is 1.27% of the $QQQ
$INTC is 0.94% of thh $SPY and is 2.67% of the $QQQ
I use ETFdb.com for my stats. A great resource to find out the holdings in ETFs and what ETFS hold a certain stock and the weight within the ETFs as well as overall shares held.
So overall we have 7.42% of the $SPY ETF reporting tonight and 22.09% of the $QQQ ETF reporting tomorrow. So this could cause big moves in the indexes tomorrow and the market overall. So how do you possible trade this into earnings
Options Trading Strategies Earnings
As Ricki the Options Whisperer from the Java Pit Trading room says, Options have options. There are 101 different ways to trade options, but this will help you with some simple strategies and concepts into trading them with earnings.
The number one important thing to remember with options into Earnings is that the Implied Volatility goes up and so does the cost of the options. Below is a screenshot from Think or Swim and their estimated Market Maker Move in Yellow.
So you see that the estimated Market Maker Move is 68.345 points. This could be either a gain or a loss with earnings. There are never any guarantees in trading.
In option chains you can see that the Market Maker Move is priced in with the premiums on the options so if you were to go outside of the Market Maker Move you would like be making better money if it moves further.
So the expected range for Amazon to report is 1993.1-68.35 =1924.75 or above 1993.1+68.35 = 2061.45. This is a very wide range and sometime AMZN can move over 100 points in a day.
Now options trading overnight into Earnings is a Gamble. There is no way to know where the price will open. The market will decide the direction. Many time the larger traders in the market already have a hint of what will happen and make their trades days or weeks before the report comes out.
I can’t advise you what to do in trading, but in my opinion unless you want to place a lotto trade into earnings for profit knowing you can lose 100% It is better to trade up to earnings with options and then the stock the day of earnings.
Options as Insurance
If you are a longer term investor there is always the possibility to buy options as insurance for your position. So say you have 100 shares of AMZN that you have been holding as it has been gaining in value.
As a vertically integrated company there has been a great amount of growth not only in the Retail Sector but also in their cloud services and now airline and robotics and potential crypto currency.
Back to insurance for your position. So you have your 100 shares and you are worried potentially about the DOJ saying they have to be broken up, or Bezos having to sell shares with his divorce or whatever the cause. Earnings is tonight and you want to make sure that those shares are protected in case of massive drop.
Knowing that the Stock has a $68 projected move you could buy cheaper options to protect yourself. You could do that on $AMZN options or also on $QQQ options as you know that it is 10% of the ETF and could case a big move.
You could buy 1 put contract on $AMZN expiring tomorrow Juy 26th at 1920 in case it had a bigger drop. The cost of that option in writing this would be 10.5 roughly or $1050 and if you had your 100 shares drop down there roughy $73 that would be a $7300 loss.
Another potential option would be an ETF that has lower cost options and might still have a big potential move. In going through the ETFS holding AMZN that have weekly options QQQ , XLY and IVV are potential option considerations. We know AMZN is 10.31% of QQQ, 23.53% of $XLY and 3.3% of IVV.
$QQQ is expecting roughly $1.93 move into tomorrow, $XLY is expecting roughly $1.26 move and $1.6 for $IVV into tomorrow.
Now we can look at the costs for that move for $QQQ to 191.5 puts for roughly $2 move it would be roughly .28 cents for $XLY a $1.26 move would put us at 122 puts costing .21 cents and finally $IVV drop would put us at 300 put roughtly .25 with wide spreads.
It looks like $XLY might be the best option to hedge in this scenario as the puts are less expensive and you could buy 50 contracts if you wanted to equal the cost of 1 AMZN put contract.
All thoughts on how you could possible protect you investment with $100 or 5 122 puts on $XLY expiring tomorrow. And as we know insurance in life is only good when you use it. If the stock gaps up you will be gaining that $100 on your 100 shares in a $1 gap up. This is the protection if you have a gap down.
Trading Options after Earnings Reporting
First of all if you have ever traded options you see that the implied volatility and cost of the options are always higher in the first couple minutes of the market open with the volatility of the stock. Once the stock settles into a direction the prices of the options drop.
Well on Earnings Day that implied volatility from the day prior drops back to normal morning open. If the market makers move was 68 pintsand it moves 60 points you might even see that you have a bit of a loss depending on what option you bought.
In the above example of buying out of the money options as insurance the implied volatility will only cover the drop and really become profitable when those options become in the money.
There are other options to trading options into earnings, with butterflies, strangles, straddles and more. Some even selling close up options and buying out a week. The abilities to use options to trade is limitless.
Bottom line is trade with proper risk management and be cautious of holding through earnings and prepare yourself for that potential move that is coming in the market tomorrow.
Tonight could be a pivotal night in the direction of the market. It could catapult is into the next new highs or it could be the beginning of the drop that everyone has been talking about.
I love hearing feedback from you. It makes my trading more personal and I like to hear how I can help you. If you would like to be in Training Pit with me sign up here or if you want one on one training you can email me jane@thedarkpools.com You can contact me here or Twitter (@ItsAirplaneJane), Instagram (missairplanejane), LinkedIn and Facebook (@sugarairplanejane) or YouTube
The tool I use for scanning and alerting is Trade Ideas who offer an always free trading room. You can receive 5% off with Promo code CARPEPROFIT15 all caps when you sign up here for your first year or month
Trade Ideas will be offering the quarterly full access test drive of their software their software in Nov 2019 for the cost of data fees $9.
Another amazing software is Trendspider that has a new innovative rain drop candlestick that shows the volume for the morning session and afternoon session as far as the weight of it in price action. You can try them for free for 7 days here and receive 20% off with MTS20
This blog is for informational and educational purposes. I am not a registered securities broker-dealer or an investment adviser. The information here is not intended as securities brokerage, investment or as an offer or solicitation of an offer to sell or buy, or as an endorsement, recommendation or sponsorship of any security or fund.
The deals for Amazon Prime Day have already started. It’s the Christmas in July sale to drive sales up mid year for Amazon. Last year the one day event was even bigger than Black Friday sales. However all of these deals are not available to everyone, they are exclusive to prime members which you can try for free for 30 days. There are some Deals exclusive to Alexa owners as well. You simply ask Alexa what deals are for you.
With Amazon as the biggest online retailer the sales that come from Amazon Prime Day Deals can create a ripple effect in the market. If the sales are higher than expected it could in turn cause Amazon to increase in price.
This increase in price would then in turn help the market to run up to newer highs. If you ever want to see what ETFs could be affected by the move of a single stock simpy go to ETFdb.com
The link above is set up for AMZN and you would quickly learn that there are 139 ETFS that could be affected by price action of AMZN. The SPY has 3.31% of its holdings in AMZN and QQQ has 10.45% of its holdings in AMZN. This information was taken from ETFdb.com. For the SPY that is the third largest holding and for QQQ the second largest holding besides MSFT. So the price action can affect the whole market.
Not only that but it can affect the rest of the Retail sector and the XRT or Retail ETF. Amazon has truly taken over the retail world and transformed it from an in store experience to an online shopping experience. It was one of Bezos visions over 20 years ago.
To me it is now Amazon shopping online first and then compare everywhere else. The interesting thing is after living in France and Italy 19 years ago to now in Canada the evolution on Amazon internationally is amazing. This is not just a simple mom and pop operation this is now global and will likely cause ripple effects in the Retail world internationally.
My tracking of Amazon quickly earned me the nickname of JungleJane in the Java Pit Trading Room. When you see what is going on with Amazon you now know how it can affect the SPY and QQQ index ETFs.
Enjoy those deals, and be prepared for this weeks announcements of the sales and how that could likely affect the price and the market overall.
I love hearing feedback from you. It makes my trading more personal and I like to hear how I can help you. If you would like to be in Training Pit with me sign up here or if you want one on one training you can email me jane@thedarkpools.com You can contact me here or Twitter (@ItsAirplaneJane), Instagram (missairplanejane), LinkedIn and Facebook (@sugarairplanejane) or YouTube
The tool I use for scanning and alerting is Trade Ideas who offer an always free trading room. You can receive 5% off with Promo code CARPEPROFIT15 all caps when you sign up here for your first year or month
Trade Ideas will be offering the quarterly full access test drive of their software their software in Nov 2019 for the cost of data fees $9.
Another amazing software is Trendspider that has a new innovative rain drop candlestick that shows the volume for the morning session and afternoon session as far as the weight of it in price action. You can try them for free for 7 days here and receive 20% off with MTS20
This blog is for informational and educational purposes. I am not a registered securities broker-dealer or an investment adviser. The information here is not intended as securities brokerage, investment or as an offer or solicitation of an offer to sell or buy, or as an endorsement, recommendation or sponsorship of any security or fund.
Today I traded CTST CannTrust for a nice a nice 14% profit while taking my daughter for her final vaccines before School. So does it hold true that you should Sell the News and Buy the Hype. In this scenario I bought the bounce of an oversold stock.
For the general public it seems this becomes a self fulfilling prophecy. Why does this happen? The basic premise of Fear in trading.
The Fear of Losing Money
When people hear bad news such as a PCG Electric company announcing that with all the fires they might have to file for Bankruptcy. Over the next three weeks the investors became fearful and sold off their holdings and the stock dropped from 46 to 6. It was the fear that could have caused the initial sell off and then as stops were triggered it snowballed down the hill.
Oversold Buying Opportunities
This fearful selling can sometimes, but not always create a buying opportunity. If you have followed my blog I like seeing the stocks that have dropped outside of the Bollinger Bands and showing an oversold RSI. Sure enough this was CTST CannTrust today. In the past three days due to the news of selling illegal pot to a Danish Company according to health Canada.
This caused the stock to drop almost 50% in 3 days. This morning at open it dropped and then volume came in and the first candle had a big wick to the bottom. I jumped in at 2.85 and set a limit order to sell 75% at 3.26. Next week I’ll tell you why I chose that number. Sure enough it went to 3.27 and pulled back.
Buying the Rumor and Fear of Missing Out
When a company get hyped up that a buyout is happening the stock jumps up. Why does this happen? First the shorts usually exit when they hear the news because they become fearful that it is going to go up even more. Then you also have to people jumping in on this rise and they want to join into the momentum with a fear of missing out.
If this news is simply hype it can drop back down as quickly as it went up leaving those buyers at the top bag holding the stock. APC Anadarko Petroleum is a perfect example of this scenario. There were two instances of this when there was a bidding war for the buyout. First it jumped up to the 60s and then up to 70s.
Overbought Selling Opportunity
If this hype of a merger or a new contract turns out to be fake news. Then it creates an overbought selling opportunity for the stock. When these fake news gaps happen it creates a price outside the upper Bollinger Bands and a selloff back to the mid line. If you know the bell curve at all the Bollinger Bands outer ranges and the midline or typically 20 SMA becomes that midline.
With timing and patience opportunities appears
Trading is all about patience in finding the setups and letting the trade develop. I enjoy the oversold stocks and watching them find a bottom and retrace back some of the gap and profit. Its about creating a watch list and monitoring them, setting alerts and being away of the daily volume and daily movement for your entries and exits.
I love hearing feedback from you. It makes my trading more personal and I like to hear how I can help you. If you would like to be in Training Pit with me sign up here or if you want one on one training you can email me jane@thedarkpools.com You can contact me here or Twitter (@ItsAirplaneJane), Instagram (missairplanejane), LinkedIn and Facebook (@sugarairplanejane) or YouTube
The tool I use for scanning and alerting is Trade Ideas who offer an always free trading room. You can receive 5% off with Promo code CARPEPROFIT15 all caps when you sign up here for your first year or month
Trade Ideas will be offering the quarterly full access test drive of their software their software in Nov 2019 for the cost of data fees $9.
Another amazing software is Trendspider that has a new innovative rain drop candlestick that shows the volume for the morning session and afternoon session as far as the weight of it in price action. You can try them for free for 7 days here and receive 20% off with MTS20
This blog is for informational and educational purposes. I am not a registered securities broker-dealer or an investment adviser. The information here is not intended as securities brokerage, investment or as an offer or solicitation of an offer to sell or buy, or as an endorsement, recommendation or sponsorship of any security or fund.
I have many women wonder how I trade as a mom of two under 5. I will not lie and say that it is not always easy. However if you want something bad enough, you figure out how to make it happen.
My husband and I have the belief that family comes first, so after reading Timothy Ferriss’ The 4-Hour Workweek I was determined to find a job to work online from anywhere.
It wasn’t easy at first. When I started in the daytrading world, I had a 6 month old and was trying to do too much. I was using self study when she was asleep and did not follow the rules. I blew through a $6,000 account in a matter of weeks. Why?
Follow the Day Trading Rules
#1 I didn”t follow the rules. Rules like for kids growing up are there for a reason and to establish good habits. Top recommendation I would say for a new trader now is paper trade during the learning phase and save capital for when you know what you are doing.
Did I have help with the kids when learning to trade? In the beginning I did not and quickly learned that after the blow up and I should study until our daughter was able to go to daycare in the mornings for a couple of hours allowing me dedicated time to watch the market. While she was home I still did my homework of watching the market at open.
Why at open? If you are new to trading you will quickly learn that it is important to have liquidity to get in and out of the market and the most volatility a day traders friend is in the first hour of the market.
Learning Something New Everyday
There is a lifetime worth of studying the market possible. All it takes to be profitable is find your strategy and follow your rules. Easy Right! It can sound easy, but if you are distracted in your brain with a sick child or a family issue then it can cloud your brain to distract you to break those rules.
As a good trading buddy of mine(Jerremy Newsome) says Trading is Easy, It’s just Hard. We all know what we are supposed to do it’s the act of actually doing it that is hard. Just like we know what a healthy lifestyle of diet and exercise is for us, but it takes daily choices and discipline to follow that healthy lifestyle.
The same is true in trading. It takes daily discipline to make the right choices for your trades. Sorry I digressed.
Daily Routine is important
So now as a mom trader, the mornings are all about being on a schedule to have the time to prep at my desk. I wake up roughy 6 am with the girls. We play, read, have pj dance parties and breakfast. I try to get them to daycare by 8 am in order to be back at my desk for 815-820. The more time I have to prep and plan out my trades the better.
Once at my desk I pull up my Trade Ideas Scanner which is an amazing scanning and alerting stock tool. That is where I find the stock to put on my watchlist. I am done at the latest by 915 and then have 15 min to center myself and join in the morning meeting in the Java Pit.
In a short 2 weeks. I’m excited to be able to give back and help new traders learn from the ground up in the Training Pit. If you want to join us in the Training Pit or Java Pit or even one on one training shoot me an email at Jane@thedarkpools.com and I will be happy to help you find your path as well.
Working from home is the best blessing. To be able to be present for my kiddos if they need me and work at night while they are sleeping or an hour in the morning. As the saying of Carpe Diem to Seize the Day, I want you to Carpe Profit and Seize those profits.
The new Training Pit Trading Room will be starting August 5th, and we are going to be covering things like how to use the software, how to place an order, How to read charts, How to understand Level 2 and so much more. There is a lifetime worth of information you can study in the market, but the basics are crucial. So If you or someone you know has an interest, then register here to be updated when the room is up and running.
We want to see you succeed and want to be your training wheels for you to have success.
I love hearing feedback from you. It makes my trading more personal and I like to hear how I can help you. If you would like to be in Training Pit with me sign up here or if you want one on one training you can email me jane@thedarkpools.com You can contact me here or Twitter (@ItsAirplaneJane), Instagram (missairplanejane), LinkedIn and Facebook (@sugarairplanejane) or YouTube
The tool I use for scanning and alerting is Trade Ideas who offer an always free trading room. You can receive 5% off with Promo code CARPEPROFIT15 all caps when you sign up here for your first year or month
Trade Ideas will be offering the quarterly full access test drive of their software their software in Nov 2019 for the cost of data fees $9.
Another amazing software is Trendspider that has a new innovative rain drop candlestick that shows the volume for the morning session and afternoon session as far as the weight of it in price action. You can try them for free for 7 days here and receive 20% off with MTS20
This blog is for informational and educational purposes. I am not a registered securities broker-dealer or an investment adviser. The information here is not intended as securities brokerage, investment or as an offer or solicitation of an offer to sell or buy, or as an endorsement, recommendation or sponsorship of any security or fund.
The short squeeze definition from Investopedia is a situation in which a heavily shorted stock or commodity moves sharply higher, forcing short sellers to close out their short positions and adding to the upward pressure on the stock. Short sellers are being squeezed out of their short positions, usually at a loss. Short squeezes are generally triggered by a positive development that suggests the stock may be embarking on a turnaround. Although the turnaround in the stock’s fortunes may only prove to be temporary, few short sellers can afford to risk runaway losses on their short positions and may prefer to close the position even if it means taking a substantial loss.
So lets break this down for everyone. These can be amazing situations when you are on the long side of the trade, but if caught short devistating. If you don’t believe me read this article about a guy that was short $KBIO back in 2015 and it gapped against him.
Many times you will see the short squeeze with a lower float stock. To me a lower float stock is one that is less than 20 million shares in the float. So now you might be asking what is the float of the stock. So the float of the stock is the amount of shares that can be traded by the public on the public stock exchange. There can be floats less than 1 million and ones bigger than 1 billion.
So I have 4 stocks up above that have all had short squeezes. These are not the only ones. There are many traders and trading rooms that follow the low float stocks for these short squeezes. The Floats for the stocks above are: NAKD 8.3mil, GEVO 6.85mil, STMP 17.09 mil, RKDA 3.18mil. This massive surge to drive a stock from 5.65 up to 65 in 7 days is totally irrational and usually the case of a short squeeze.
The easiest scanner that I have used to find these moves is Trade Ideas. If you are a current subscriber of Trade Ideas you can copy this cloud link and upload it into your cloud to add to your scanners. That is one of the coolest share great alerting windows.
These stocks move very quickly and make amazing gains. Here is a sample from RKDA this week.
Here you can see this stock almost doubled overnight.
So what happened. There was a catalyst or news anouncement that was released saying that RKDA is entering into the cannabis sector. Sure enough that was enought to get people on board to buy. You can see the trip up to 10.40 was not a straight move up. It ran premarket the orange area from 5.63 up to 9.4 and then a sell off down to 7 in the first 15 min of normal trading hours. So these stocks are great for volatile moves, but you have to be prepared to act quickly. Many of the traders that trade these type of stocks actually use hot keys with their brokers to make sure that they execute their trades quickly without having to enter the order while the stock is moving against them.
These stocks if you can get shares to short are great when it continues to the downside, but I will show you an example where the shorts of RKDA last year thought it was going to be an easy ride down with a close at $12 and it resulted in the stock running to $52 the next day.
All of this is based on supply and demand. The low supply (float) and low float traders buying and shorts being squeezed (many times forced to buy back the stock ) causes dramatic life changing moves.
I love hearing feedback from you. It makes my trading more personal and I like to hear how I can help you. If you have questions or comments you can contact me here or on Profitly, Twitter (@jane_yul), Instagram (missairplanejane), LinkedIn and Facebook (@sugarairplanejane). carpeprofit@gmail.com or YouTube
For my charts I use tradingview.com which offer free charting and paid services
This blog is for information purposes. I am not a registered securities broker-dealer or an investment adviser. The information here is not intended as securities brokerage, investment or as an offer or solicitation of an offer to sell or buy, or as an endorsement, recommendation or sponsorship of any security or fund.
We are at a crucial point in the market right now and looking back 1 year it might be more important than we know. I was looking at the Natural Gas levels last year for a seasonal trade on gas and noticed that the high of the begining of the year was Jan 29th and then almost a month long trade to Feb 15th for a low before finding a bottom.
I then began curious to know if somehow the gas futures could also correspond to the market action as well. Sure enough I looked back at the $SPY for Jan 2018 and noticed that yes the high of the market for the beginning of the year was on Friday Jan 26th for a high of and then dropped down to find a new low. Sure enough it peaked at End of Day on the 4th friday of the month and then found a bottom on Feb 9th around 1pm.
When I look back historically at this time frame there doesn’t seem to be an exact drop amount. For 2017 there was a new high on the 26th to only have a 5 day pull back.
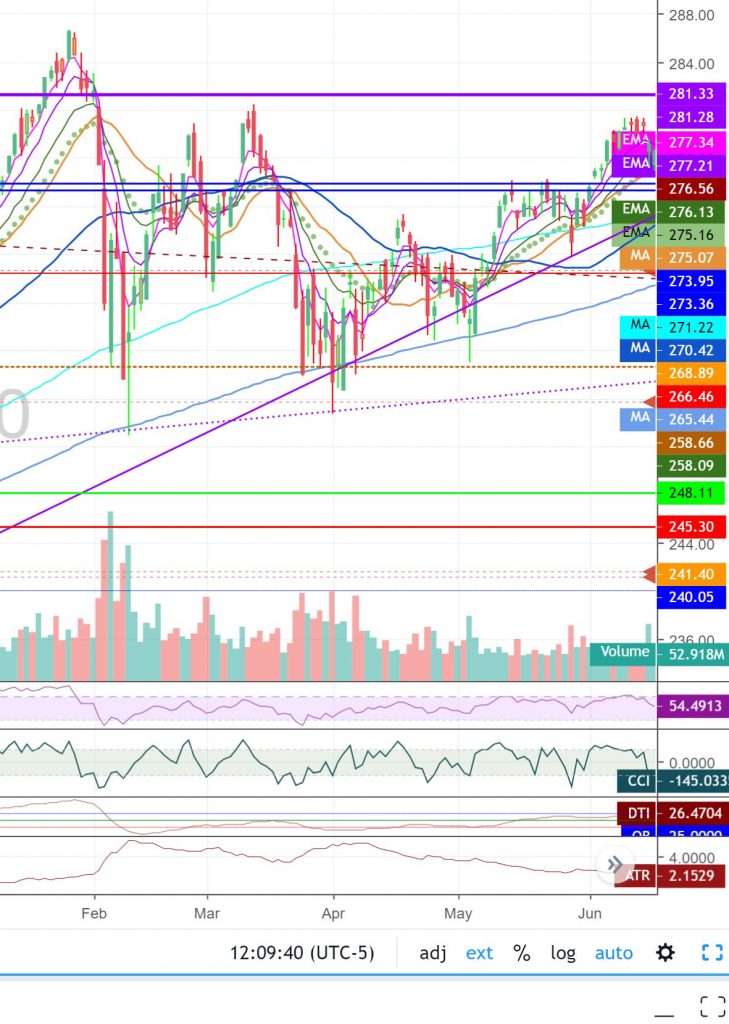
When I calculated the drop from last Jan 26th Close of 286.58 to the close of Feb 8th of 257.63 that equates a 10.10% drop. If history repeats itself and we have a High close of the price action of me writing this right now of 266.11 and we have the same 10.10% drop in the market to Feb 8th we are looking at a price of roughly 239.23. So this Friday last year was a very crucial point in the market. The past two weeks seems like a positioning for the big guys in moves to either the upside or the downside.
In the $SPY weekly chart you can see we are currently at a resistance point and for the past the week we have really consolidated price action between the 8ema 261 to the 21 ema of 266.84. There feels like there is tension here in the market to surge higher or to break down from the resistance we shall see we we go Monday. For sure there will be a big move coming it is will we break up to the 50 SMA of 272.76 for a test or back down to 235.79 200 SMA. Wow look at that coincidence. a 10.10% drop would have us close at 239.23 4 points away from 200 SMA.
The market will definitely decide and for those that like to put on lotto trades with options you might want to consider a SPY lotto put of 239 for Feb 15th for .27.
My last blog post I mentioned in 2008 we dropped to 200 SMA on weekly and then to 50 SMA and down to 50% valuation of the SPY. Lets see where we go from here. For now we might have that surge to 272 and then drop to 150. Love tracking the action and trading what the market gives each day.
I love hearing feedback from you. It makes my trading more personal and I like to hear how I can help you. If you have quest.ions or comments you can contact me here or on Profitly, Twitter (@jane_yul), Instagram (missairplanejane), LinkedIn and Facebook (@sugarairplanejane). carpeprofit@gmail.com or YouTube
This blog is for information purposes. I am not a registered securities broker-dealer or an investment adviser. The information here is not intended as securities brokerage, investment or as an offer or solicitation of an offer to sell or buy, or as an endorsement, recommendation or sponsorship of any security or fund.
When you are a trader it can be very lonely at times. When I first started and I was studying online I felt I needed a community to help me along on my journey. It always helps to know that there are others that have walked in your shoes or can sympathize with what you are going through and the emotions you might be feeling.
Just like when someone goes through a divorce, they feel like them might be the only person that is feeling this pain and difficulty in life. The reality is that many people have dealt with divorce. If you speak with others it can help lift you out of your personal funk and downward pyschological spiral.
All that said a trading community can help you with your trading in my opinion.
Connect with a community
There are more trading chat rooms and trading rooms and stock education platforms out there in which you can share with others. I know that for me the first community of traders I entered was a filled with a bit too much testosterone and one up man ship. Who was the best? That mindest was not the best for me because it made me feel poorly if I had an error in the beginning.
I then reset and joined a second trading community that offered 3 different points of views instead of just one traders viewpoint. This really helped me to learn that your winning strategy has to mesh with your capital that you can commit, your timeframe you can commit and your risk tolerance.
This acceptance by a community of traders virutally is great, however having a chance to meet with them in person is even more fulfilling. That was the whole reason why I developed the Modern Traders Summit.
The Basis of the Modern Traders Summit is for traders to come together in a real life atmosphere to share their experiences, their techniques and connect in person. The first trading seminar I went to was a year and a half into my day trading career and afterwards I realized that if I had visited one in the first 6 months I could have streamlined my learning curve.
So in 2018 the Modern Traders Summit was born to bring positive traders to speak to other traders and interact. This is not your sales pitch type summit it is to help other traders and really allow you time in person with some bigger names in the trading world. There will also be a live trading day on the second day so you can see them in action. No putting them up on a pedestal, they are right there with you to help you.
This year it will be held in Philadelphia Sunday and Monday July 12,13th right in downtown by city hall. Seats are limited and selling out quickly, so make sure to reserve yours before we sell out.
There are two methods of thinking the Glass Half Full or the Glass Half Empty. Do you have the scarcity mindset? Do you worry about not having enough money or enough free time? You have the ability to change that and it comes with the people that you surround yourself with on a daily basis.
If you find yourself in a trading room that does not fulfill your positive thought tank of yourself or your thoughts then maybe you need to assess if it is the best for you. I know I went through that in the beginning of my day trading.
You can beat yourself up or you can have environment that says hey learn from your mistakes you are along the way in your journey. You are new or learning a new strategy be kind to yourself and know that no one was perfect at the start.
There is so much pyschology in Trading and if your trading community isnt giving you the ability to self reflect in a positive way, then do you want to stay there?
I mean do you think that Surgeons knew just what to do their first day of medical school. I highly doubt it and you do yourself an injustice when you look yourself in the mirror and you tell yourself you suck or your are awful because you had a bad trade.
All that being said I want to tell you the traders that I mesh with the most in their positive environments.
Top Chat Rooms
Some people say chat rooms and I prefer to say trading room. The top trading rooms to me are
All of these are run my amazing people that have the vision of abundance and wealth for everyone in their trading communities. They are all Positive environments.
Has been set up to help traders in understanding how Trade Ideas Software can help you profit. There are some amazing traders there that help fellow traders on a daily basis from the goodness of their hearts. There is no negativity allowed by Barrie the Moderator. For a newer trader that might want to learn a bit before they can afford the scanning software or the costs of a trading room it is a great first step.
The Training Pit, run by the Stock Whisperer Trading Company, is where I am one of four teachers that help new traders learn from zero knowledge or those that really want to reboot their trading to learn to trade around the darkpools. We take nothing for granted and teach you from the ground up. (What is a Stock, Brokers, Setting up Software, Which Brokers to Choose, Daily Whisper, Daily Whisper Video, Over 40 live webinars a month, and the webinars are able to be downloaded if you miss them live while you are a subscriber ) This trading room is $99 a month
The Java Pit is also run by Stefanie Kammerman the Founder of the Stock Whisperer Trading Company. The Java Pit is not a room for a beginner as you definitely need to understand timing of trading, how to trade stocks, options and trading around the darkpool. If you are interested in joining the Java Pit you can email Stefanie ( Stefanie@thestockwhisperer.com ) and she might recomment Boot Camp to complete all the requirements stated above.
Bulls on Wall Street is run by Kunal Desai and Paul Singh. Kunal and Paul are two individuals that want to help many traders expand their knowledge and break down trading into simple strategies to profit. They offer free training and ebook as well for newer traders that want to learn more about trading.
Bear Bulls Traders – Day Trading Community established to help new traders
Bear Bulls Traders was founded by multi best selling author Andrew Aziz. Andrew came to trading after also being laid off and looking for a career in the trading world. Andrew likes to emphasize risk management and helping others in his trading community as he was also a newer trader at one time and enjoys hearing the success stories of others.
Jerremy Alexander Newsome is one of the most positive people I have met. He grew up working hard for his capital that he used for trading. Again as most professional traders Jerremy concentrates on simplistic strategies for traders to profit. Talking about R – risk and banking R month after month with proper risk management. He is a Jerremy of all trades and also hosts his own Traders summit as well as authoring a trading book.
I love hearing feedback, so please share. You can also contact me on my social media accounts Twitter (@ItsAirplaneJane), Instagram (missairplanejane), LinkedIn and Facebook (@sugarairplanejane) or YouTube
The tool I use for scanning and alerting is Trade Ideas who offer an always free trading room. You can receive 5% off with Promo code CARPEPROFIT15 all caps when you sign up here for your first year or month
Trade Ideas will be offering the quarterly full access test drive of their software their software in Nov 2019 for the cost of data fees $9.
Another amazing software is Trendspider that has a new innovative rain drop candlestick that shows the volume for the morning session and afternoon session as far as the weight of it in price action. You can try them for free for 7 days here and receive 20% off with MTS20
This blog is for informational and educational purposes. I am not a registered securities broker-dealer or an investment adviser. The information here is not intended as securities brokerage, investment or as an offer or solicitation of an offer to sell or buy, or as an endorsement, recommendation or sponsorship of any security or fund.
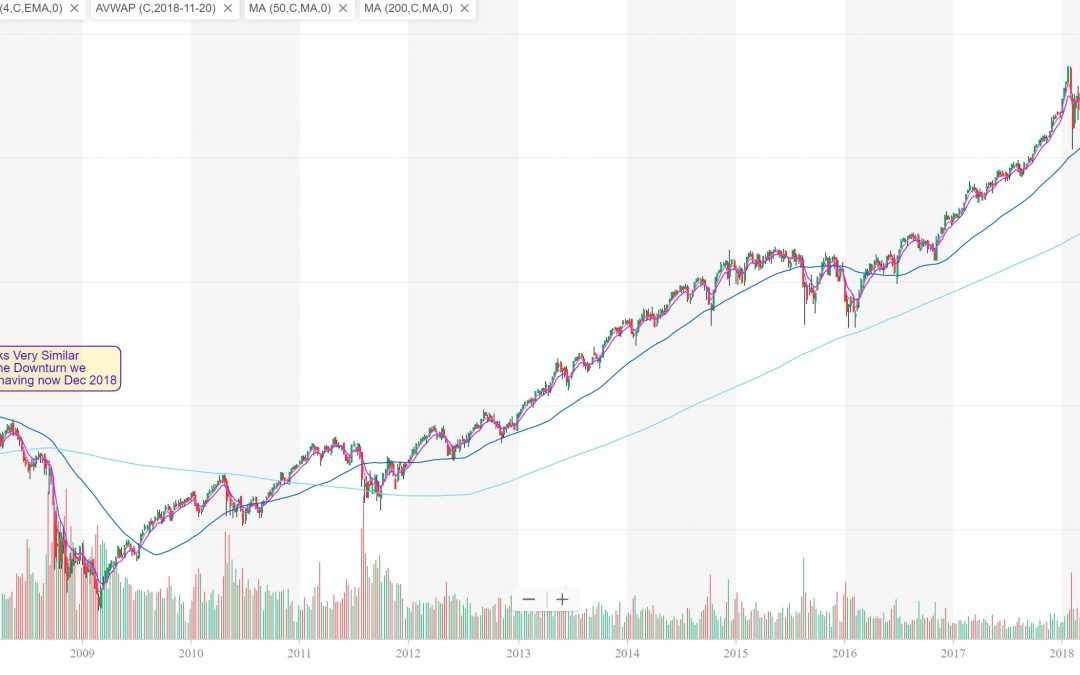
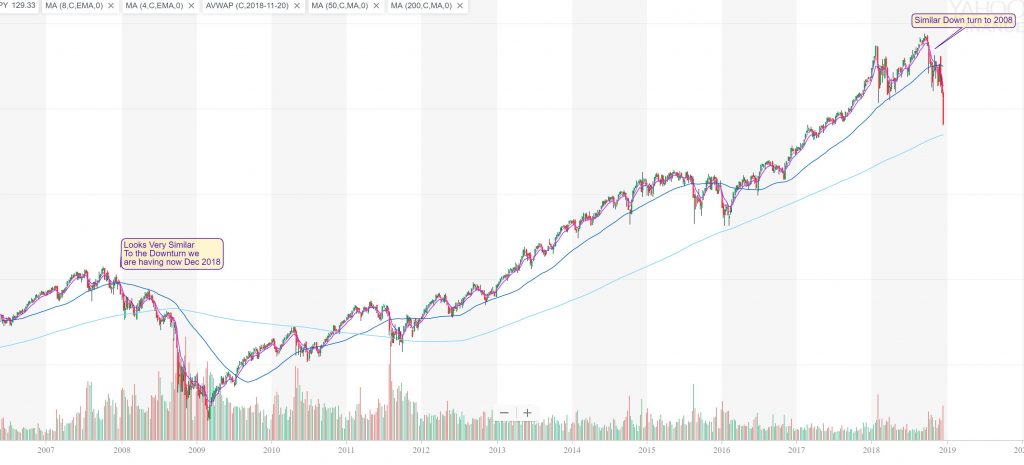
Back on December 13th I noticed the similarities of the crash of 2008/09 and posted on Twitter.
Sure enough we are starting to see the breakdown on the entire market. Im looking into the past to potentially see if the pattern repeats itself it looks like we could break the 200 SMA on weekly chart below and see a big downturn before we see the bottom.
In looking at the past to potentially see the pattern of the future it looks like we will test the 200 SMA on the weekly chart and then test the 50 SMA and if we break 200 SMA again watch out below.
The 50 SMA on the weekly is 274.55 which we broke earlier in December. The 200 weekly SMA is at 234.53 which we could hit potentially this week and then a bounce back up to 50 SMA and a further huge drop down like in 2008 where the support was below the support of 2003 of 67.10….This is proving we could see a very couple of ugly bearish market months to years ahead if the market doesnt break up above the 50 SMA on the weekly chart. I will be on watch and sharing my opinion weekly as it happens. Bottom line is the market is always right and go with the trend.
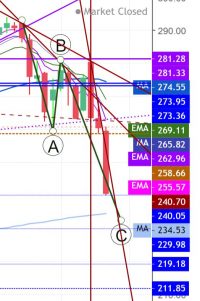
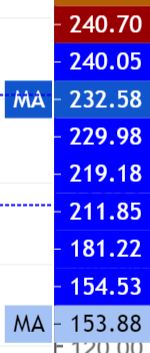
Below is another bigger picture view to see the support levels on the way down.
On the left is a blow up of support levels from the chart above. On Friday 12.21.18 we closed at 240.70. The royal blue are the support levels and the light blue is 200 Monthly SMA and the peacock blue is the 50 Monthly SMA to watch in the down trend. I would not be suprised if into Jan and Feb we go all the way down to 200 SMA of 154.
The tool I use for scanning and alerting is Trade Ideas who offer an always free trading room. 25% Off First Month or First Annual – Promo Code HOLLYCHRISTMAS25 through Christmas Day
I’m also offering 20% off my site through Christmas Day for my book or my watchlist with promo code SANTA
I love hearing feedback from you. It makes my trading more personal and I like to hear how I can help you. If you have quest.ions or comments you can contact me here or on Profitly, Twitter (@jane_yul), Instagram (missairplanejane), LinkedIn and Facebook (@sugarairplanejane). carpeprofit@gmail.com or YouTube
For the fastest level 2 I have found I use Equityfeed.
This blog is for information purposes. I am not a registered securities broker-dealer or an investment adviser. The information here is not intended as securities brokerage, investment or as an offer or solicitation of an offer to sell or buy, or as an endorsement, recommendation or sponsorship of any security or fund.
This website uses cookies so that we can provide you with the best user experience possible. Cookie information is stored in your browser and performs functions such as recognising you when you return to our website and helping our team to understand which sections of the website you find most interesting and useful.
Strictly Necessary Cookies
Strictly Necessary Cookie should be enabled at all times so that we can save your preferences for cookie settings.
If you disable this cookie, we will not be able to save your preferences. This means that every time you visit this website you will need to enable or disable cookies again.