The deals for Amazon Prime Day have already started. It’s the Christmas in July sale to drive sales up mid year for Amazon. Last year the one day event was even bigger than Black Friday sales. However all of these deals are not available to everyone, they are exclusive to prime members which you can try for free for 30 days. There are some Deals exclusive to Alexa owners as well. You simply ask Alexa what deals are for you.
With Amazon as the biggest online retailer the sales that come from Amazon Prime Day Deals can create a ripple effect in the market. If the sales are higher than expected it could in turn cause Amazon to increase in price.
This increase in price would then in turn help the market to run up to newer highs. If you ever want to see what ETFs could be affected by the move of a single stock simpy go to ETFdb.com
The link above is set up for AMZN and you would quickly learn that there are 139 ETFS that could be affected by price action of AMZN. The SPY has 3.31% of its holdings in AMZN and QQQ has 10.45% of its holdings in AMZN. This information was taken from ETFdb.com. For the SPY that is the third largest holding and for QQQ the second largest holding besides MSFT. So the price action can affect the whole market.
Not only that but it can affect the rest of the Retail sector and the XRT or Retail ETF. Amazon has truly taken over the retail world and transformed it from an in store experience to an online shopping experience. It was one of Bezos visions over 20 years ago.
To me it is now Amazon shopping online first and then compare everywhere else. The interesting thing is after living in France and Italy 19 years ago to now in Canada the evolution on Amazon internationally is amazing. This is not just a simple mom and pop operation this is now global and will likely cause ripple effects in the Retail world internationally.
My tracking of Amazon quickly earned me the nickname of JungleJane in the Java Pit Trading Room. When you see what is going on with Amazon you now know how it can affect the SPY and QQQ index ETFs.
Enjoy those deals, and be prepared for this weeks announcements of the sales and how that could likely affect the price and the market overall.
I love hearing feedback from you. It makes my trading more personal and I like to hear how I can help you. If you would like to be in Training Pit with me sign up here or if you want one on one training you can email me jane@thedarkpools.com You can contact me here or Twitter (@ItsAirplaneJane), Instagram (missairplanejane), LinkedIn and Facebook (@sugarairplanejane) or YouTube
The tool I use for scanning and alerting is Trade Ideas who offer an always free trading room. You can receive 5% off with Promo code CARPEPROFIT15 all caps when you sign up here for your first year or month
Trade Ideas will be offering the quarterly full access test drive of their software their software in Nov 2019 for the cost of data fees $9.
Another amazing software is Trendspider that has a new innovative rain drop candlestick that shows the volume for the morning session and afternoon session as far as the weight of it in price action. You can try them for free for 7 days here and receive 20% off with MTS20
This blog is for informational and educational purposes. I am not a registered securities broker-dealer or an investment adviser. The information here is not intended as securities brokerage, investment or as an offer or solicitation of an offer to sell or buy, or as an endorsement, recommendation or sponsorship of any security or fund.
Today I traded CTST CannTrust for a nice a nice 14% profit while taking my daughter for her final vaccines before School. So does it hold true that you should Sell the News and Buy the Hype. In this scenario I bought the bounce of an oversold stock.
For the general public it seems this becomes a self fulfilling prophecy. Why does this happen? The basic premise of Fear in trading.
The Fear of Losing Money
When people hear bad news such as a PCG Electric company announcing that with all the fires they might have to file for Bankruptcy. Over the next three weeks the investors became fearful and sold off their holdings and the stock dropped from 46 to 6. It was the fear that could have caused the initial sell off and then as stops were triggered it snowballed down the hill.
Oversold Buying Opportunities
This fearful selling can sometimes, but not always create a buying opportunity. If you have followed my blog I like seeing the stocks that have dropped outside of the Bollinger Bands and showing an oversold RSI. Sure enough this was CTST CannTrust today. In the past three days due to the news of selling illegal pot to a Danish Company according to health Canada.
This caused the stock to drop almost 50% in 3 days. This morning at open it dropped and then volume came in and the first candle had a big wick to the bottom. I jumped in at 2.85 and set a limit order to sell 75% at 3.26. Next week I’ll tell you why I chose that number. Sure enough it went to 3.27 and pulled back.
Buying the Rumor and Fear of Missing Out
When a company get hyped up that a buyout is happening the stock jumps up. Why does this happen? First the shorts usually exit when they hear the news because they become fearful that it is going to go up even more. Then you also have to people jumping in on this rise and they want to join into the momentum with a fear of missing out.
If this news is simply hype it can drop back down as quickly as it went up leaving those buyers at the top bag holding the stock. APC Anadarko Petroleum is a perfect example of this scenario. There were two instances of this when there was a bidding war for the buyout. First it jumped up to the 60s and then up to 70s.
Overbought Selling Opportunity
If this hype of a merger or a new contract turns out to be fake news. Then it creates an overbought selling opportunity for the stock. When these fake news gaps happen it creates a price outside the upper Bollinger Bands and a selloff back to the mid line. If you know the bell curve at all the Bollinger Bands outer ranges and the midline or typically 20 SMA becomes that midline.
With timing and patience opportunities appears
Trading is all about patience in finding the setups and letting the trade develop. I enjoy the oversold stocks and watching them find a bottom and retrace back some of the gap and profit. Its about creating a watch list and monitoring them, setting alerts and being away of the daily volume and daily movement for your entries and exits.
I love hearing feedback from you. It makes my trading more personal and I like to hear how I can help you. If you would like to be in Training Pit with me sign up here or if you want one on one training you can email me jane@thedarkpools.com You can contact me here or Twitter (@ItsAirplaneJane), Instagram (missairplanejane), LinkedIn and Facebook (@sugarairplanejane) or YouTube
The tool I use for scanning and alerting is Trade Ideas who offer an always free trading room. You can receive 5% off with Promo code CARPEPROFIT15 all caps when you sign up here for your first year or month
Trade Ideas will be offering the quarterly full access test drive of their software their software in Nov 2019 for the cost of data fees $9.
Another amazing software is Trendspider that has a new innovative rain drop candlestick that shows the volume for the morning session and afternoon session as far as the weight of it in price action. You can try them for free for 7 days here and receive 20% off with MTS20
This blog is for informational and educational purposes. I am not a registered securities broker-dealer or an investment adviser. The information here is not intended as securities brokerage, investment or as an offer or solicitation of an offer to sell or buy, or as an endorsement, recommendation or sponsorship of any security or fund.
We are at a crucial point in the market right now and looking back 1 year it might be more important than we know. I was looking at the Natural Gas levels last year for a seasonal trade on gas and noticed that the high of the begining of the year was Jan 29th and then almost a month long trade to Feb 15th for a low before finding a bottom.
I then began curious to know if somehow the gas futures could also correspond to the market action as well. Sure enough I looked back at the $SPY for Jan 2018 and noticed that yes the high of the market for the beginning of the year was on Friday Jan 26th for a high of and then dropped down to find a new low. Sure enough it peaked at End of Day on the 4th friday of the month and then found a bottom on Feb 9th around 1pm.
When I look back historically at this time frame there doesn’t seem to be an exact drop amount. For 2017 there was a new high on the 26th to only have a 5 day pull back.
When I calculated the drop from last Jan 26th Close of 286.58 to the close of Feb 8th of 257.63 that equates a 10.10% drop. If history repeats itself and we have a High close of the price action of me writing this right now of 266.11 and we have the same 10.10% drop in the market to Feb 8th we are looking at a price of roughly 239.23. So this Friday last year was a very crucial point in the market. The past two weeks seems like a positioning for the big guys in moves to either the upside or the downside.
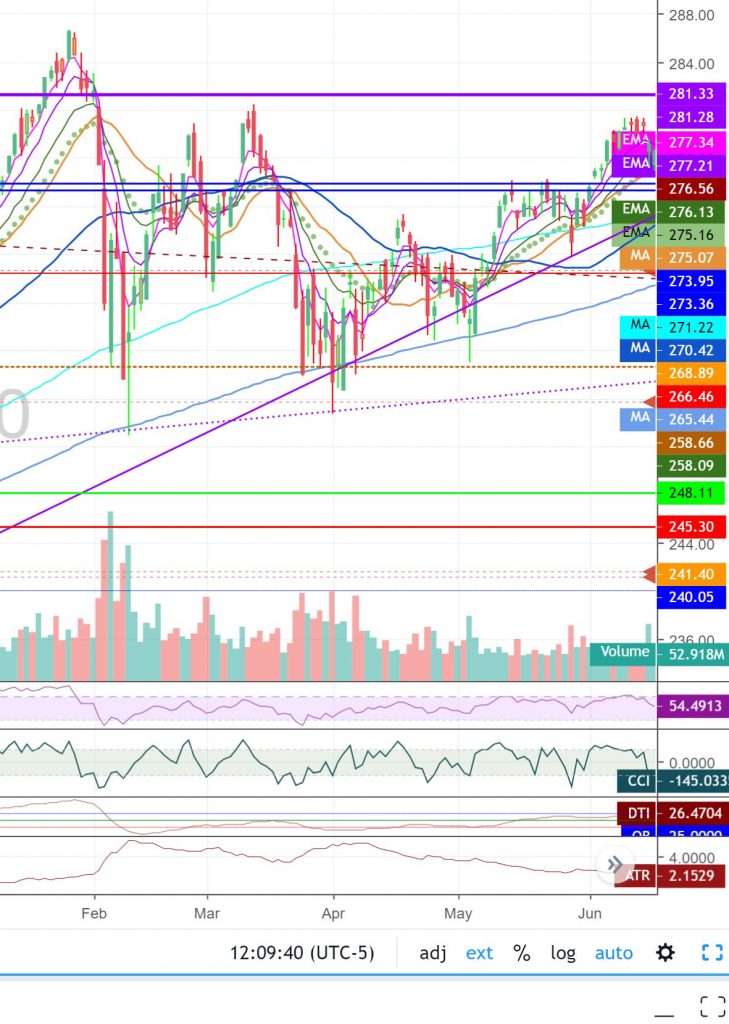
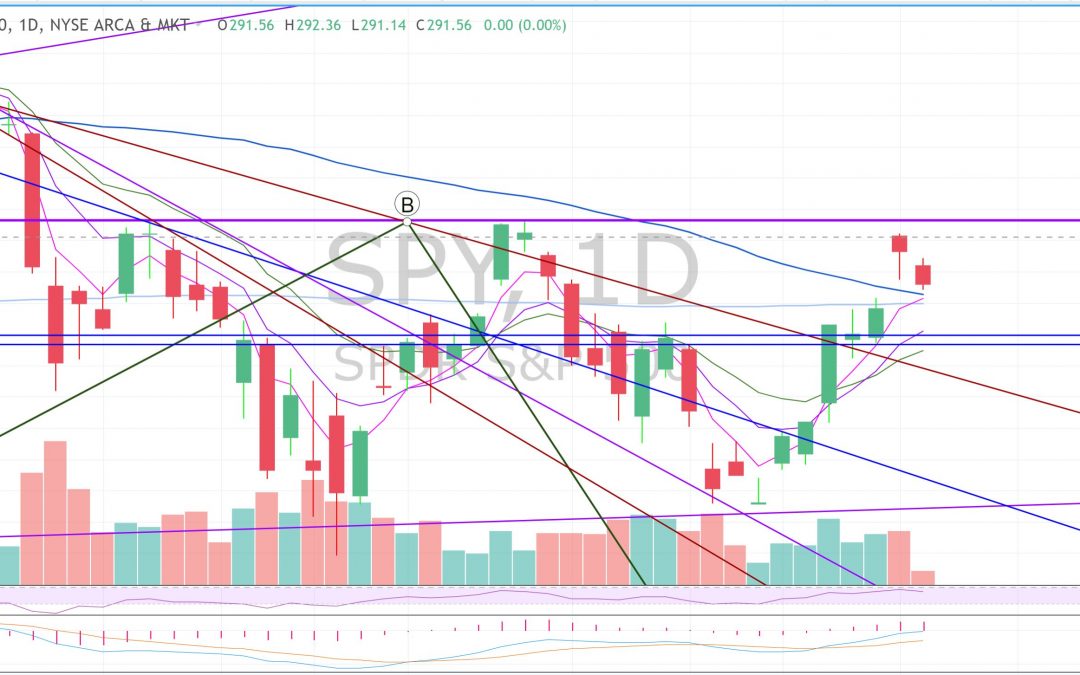
In the $SPY weekly chart you can see we are currently at a resistance point and for the past the week we have really consolidated price action between the 8ema 261 to the 21 ema of 266.84. There feels like there is tension here in the market to surge higher or to break down from the resistance we shall see we we go Monday. For sure there will be a big move coming it is will we break up to the 50 SMA of 272.76 for a test or back down to 235.79 200 SMA. Wow look at that coincidence. a 10.10% drop would have us close at 239.23 4 points away from 200 SMA.
The market will definitely decide and for those that like to put on lotto trades with options you might want to consider a SPY lotto put of 239 for Feb 15th for .27.
My last blog post I mentioned in 2008 we dropped to 200 SMA on weekly and then to 50 SMA and down to 50% valuation of the SPY. Lets see where we go from here. For now we might have that surge to 272 and then drop to 150. Love tracking the action and trading what the market gives each day.
I love hearing feedback from you. It makes my trading more personal and I like to hear how I can help you. If you have quest.ions or comments you can contact me here or on Profitly, Twitter (@jane_yul), Instagram (missairplanejane), LinkedIn and Facebook (@sugarairplanejane). carpeprofit@gmail.com or YouTube
This blog is for information purposes. I am not a registered securities broker-dealer or an investment adviser. The information here is not intended as securities brokerage, investment or as an offer or solicitation of an offer to sell or buy, or as an endorsement, recommendation or sponsorship of any security or fund.
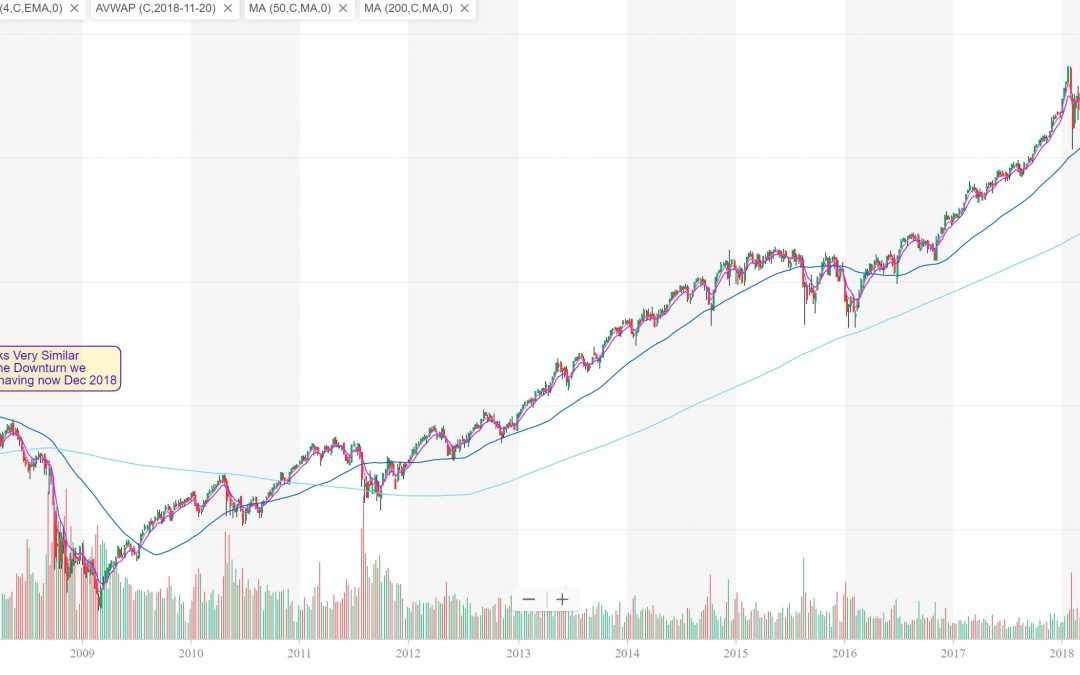
Back on December 13th I noticed the similarities of the crash of 2008/09 and posted on Twitter.
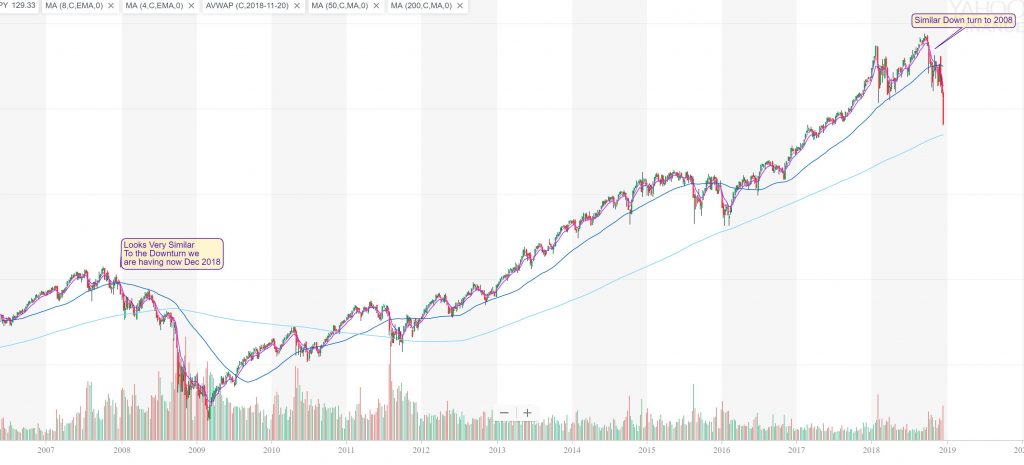
Sure enough we are starting to see the breakdown on the entire market. Im looking into the past to potentially see if the pattern repeats itself it looks like we could break the 200 SMA on weekly chart below and see a big downturn before we see the bottom.
In looking at the past to potentially see the pattern of the future it looks like we will test the 200 SMA on the weekly chart and then test the 50 SMA and if we break 200 SMA again watch out below.
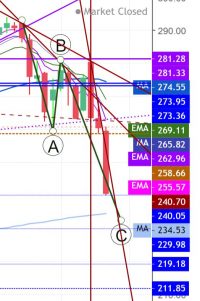
The 50 SMA on the weekly is 274.55 which we broke earlier in December. The 200 weekly SMA is at 234.53 which we could hit potentially this week and then a bounce back up to 50 SMA and a further huge drop down like in 2008 where the support was below the support of 2003 of 67.10….This is proving we could see a very couple of ugly bearish market months to years ahead if the market doesnt break up above the 50 SMA on the weekly chart. I will be on watch and sharing my opinion weekly as it happens. Bottom line is the market is always right and go with the trend.
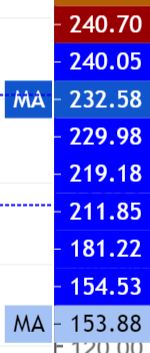
Below is another bigger picture view to see the support levels on the way down.
On the left is a blow up of support levels from the chart above. On Friday 12.21.18 we closed at 240.70. The royal blue are the support levels and the light blue is 200 Monthly SMA and the peacock blue is the 50 Monthly SMA to watch in the down trend. I would not be suprised if into Jan and Feb we go all the way down to 200 SMA of 154.
The tool I use for scanning and alerting is Trade Ideas who offer an always free trading room. 25% Off First Month or First Annual – Promo Code HOLLYCHRISTMAS25 through Christmas Day
I’m also offering 20% off my site through Christmas Day for my book or my watchlist with promo code SANTA
I love hearing feedback from you. It makes my trading more personal and I like to hear how I can help you. If you have quest.ions or comments you can contact me here or on Profitly, Twitter (@jane_yul), Instagram (missairplanejane), LinkedIn and Facebook (@sugarairplanejane). carpeprofit@gmail.com or YouTube
For the fastest level 2 I have found I use Equityfeed.
This blog is for information purposes. I am not a registered securities broker-dealer or an investment adviser. The information here is not intended as securities brokerage, investment or as an offer or solicitation of an offer to sell or buy, or as an endorsement, recommendation or sponsorship of any security or fund.
So we all thought yes the recovery is here. Great news with G20 and the new agreements to be enacted with Mexico and Canada and positive news about a tarrif halt for 90 days. That shot the SPY ETf up to that 281 resistance area premartket on Monday Dec 3rd. Yet there was no continuation to the upside to break out. We did break the brown monthly trend line to the upside and through the 200 day SMA. Yet there is more and more press of a recession coming, which leads me to believe this is going to end up in selling from investors on the bounce instead of influx of new money. It we break the 200 (light blue) and 50(dark blue) SMAs then we will likely have the death cross of the averages indicating more of a downturn to come. We shall see if my post of a 236 are in January is correct.
I’m curious to see where this week ends because that 200 SMA is right near by at 275.99 and to me a close above will indicate the buyers want to see the market recover. A close below this week and the sellers are taking losses for maybe tax purposes and will buy back cheaper, but it might be a while before a strong uptrend. Will see where the market takes us.
For now I use Trade Ideas to find those Alpha stocks Like $AZO where on Earnings it broke out from the premarket highs and then ran up a nice $24 to a pullback and support for a secondary run before the market drop pulled it down. A close above 870 would lead me to believe that this will have a couple days to the upside if the market doesn’t drag it down.
I love hearing feedback from you. It makes my trading more personal and I like to hear how I can help you. If you have quest.ions or comments you can contact me here or on Profitly, Twitter (@jane_yul), Instagram (missairplanejane), LinkedIn and Facebook (@sugarairplanejane). carpeprofit@gmail.com or YouTube
My book is available at Amazon FMJ Trust Transition Trade: How Successful Traders Said It, Did It, and Lived It . As well as Barnes and Noble, Indigo, Chapters,and more.
If you want a signed copy please go to the book site
The tool I use for scanning and alerting is Trade Ideas who offer an always free trading room. 15% Off First Month or First Annual – Promo Code CARPEPROFIT15
For my charts I use tradingview.com which offer free charting and paid services
Also Stocks To Trade that has a 1 week $1 trial
For the fastest level 2 I have found I use Equityfeed.
This blog is for information purposes. I am not a registered securities broker-dealer or an investment adviser. The information here is not intended as securities brokerage, investment or as an offer or solicitation of an offer to sell or buy, or as an endorsement, recommendation or sponsorship of any security or fund.
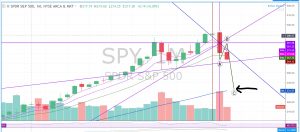
That’s right! Isn’t it nice of the market to drop all the prices this week for Black Friday, Cyber Monday sale. It just so happens that the market is about to come down and test a trend line that has acted as support all year. The lower Trend line that has the A acted as support for the second time as a bounce spot. When we pull it back on the Weekly chart below it becomes more clear. This will now be the third test of the trend line this year. Just recently I learned about the Elliot Wave and to me this is looking like the SPY wants to drop further in this correction C wave to the Monthly 200 SMA of roughly 236. In looking at all the FAANG Stocks $FB, $APPL, $AMZN, $NFLX and $GOOGL are still dropping below the 200 SMA. In Fact more than 60% of the NYSE stocks are below the 200 SMA a good indication of a bearish trend. The furhther out that you pull the indexes you will see that there is a bigger trend of down for now. Also on the weekly chart we do not have the big volume coming in yet that indicates the buying is happening. Will definitely be watching the test of the trend line for a break or bounce.
What are your thoughts on the market sentiment? Shot me your thoughts in the comment area.
The market as a whole isnt the only area for sales. There are a bunch of sales like everywhere else.
My watchlist is 20% off with Promo Code “THANKS” Through Cyber Monday.
The charts above are from Trading View and they are having their annual 60% off sale on their charting paid services. Trade Ideas is offering 20% off with “GOODGRAVY”
I hope that these analysis posts are helping you to see the big picture of the market right now. This correction or bigger bear market is a normal occurance of the market to later set new highs. It will be determined in my opinion when we see that big candle like the first test of the trend line that indicates buying is happening. The volume dictates who is winning the bears or the bulls.
I love hearing feedback from you. It makes my trading more personal and I like to hear how I can help you. If you have quest.ions or comments you can contact me here or on Profitly, Twitter (@jane_yul), Instagram (missairplanejane), LinkedIn and Facebook (@sugarairplanejane). carpeprofit@gmail.com or YouTube
My book is available at Amazon FMJ Trust Transition Trade: How Successful Traders Said It, Did It, and Lived It . As well as Barnes and Noble, Indigo, Chapters,and more.
If you want a signed copy please go to the book site
The tool I use for scanning and alerting is Trade Ideas who offer an always free trading room. 15% Off First Month or First Annual – Promo Code CARPEPROFIT15
For my charts I use tradingview.com which offer free charting and paid services
Also Stocks To Trade that has a 1 week $1 trial
For the fastest level 2 I have found I use Equityfeed.
This blog is for information purposes. I am not a registered securities broker-dealer or an investment adviser. The information here is not intended as securities brokerage, investment or as an offer or solicitation of an offer to sell or buy, or as an endorsement, recommendation or sponsorship of any security or fund.
This website uses cookies so that we can provide you with the best user experience possible. Cookie information is stored in your browser and performs functions such as recognising you when you return to our website and helping our team to understand which sections of the website you find most interesting and useful.
Strictly Necessary Cookies
Strictly Necessary Cookie should be enabled at all times so that we can save your preferences for cookie settings.
If you disable this cookie, we will not be able to save your preferences. This means that every time you visit this website you will need to enable or disable cookies again.


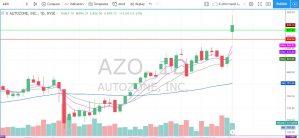 where on Earnings it broke out from the premarket highs and then ran up a nice $24 to a pullback and support for a secondary run before the market drop pulled it down. A close above 870 would lead me to believe that this will have a couple days to the upside if the market doesn’t drag it down.
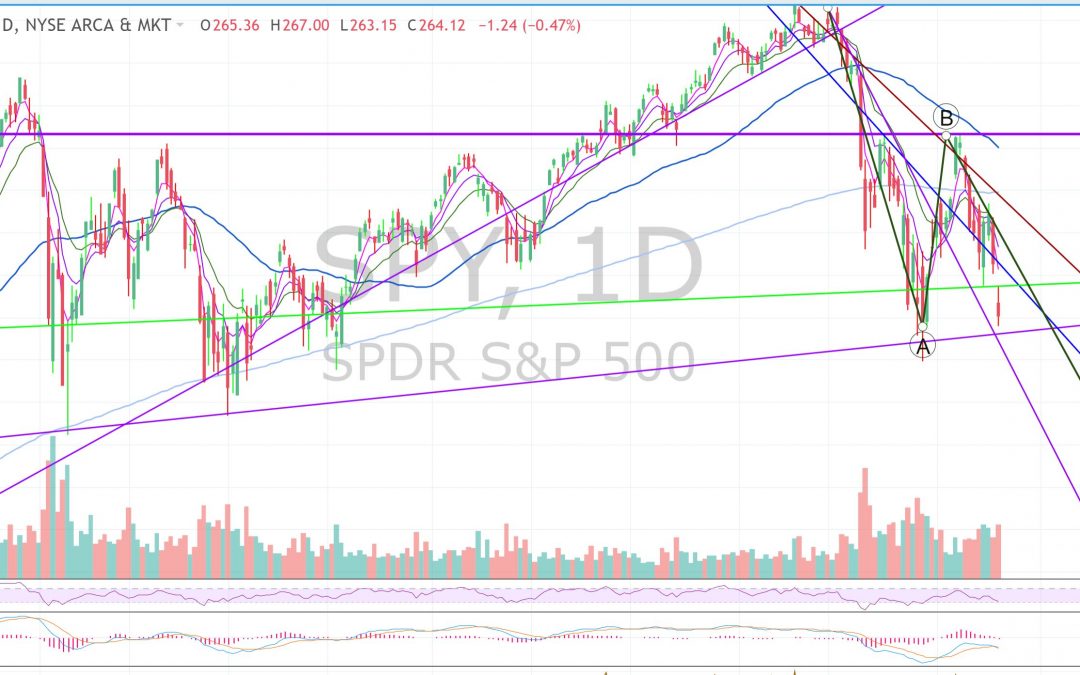
 This will now be the third test of the trend line this year. Just recently I learned about the