This weekend being Martin Luther King weekend we had an extra day off from the market. As always in doing my prep for the weekend, I review the headlines on FinTwit. Yes, I check out what others are posting and talking about on Twitter.
Sure enough I saw this one tweet and I thought to myself this might be the top of the market.

In seeing this and the chart above it makes you wonder. The big guys in the market always take it to a new high before we sell off. So I began doing more research in the market. I like checking yahoo finance on my phone as I tend to see extra signs in the charts.
Stock Chart Signals
The chart below shows exactly what I’m talking about. This is a 15 min chart of the SPY ETF or S&P 500 Equity Traded Fund. The Candlestick highlighted shows 36.38 million shares traded in a 15 min timeframe between 331.6-331.79. Now when you do the math that is roughly 12 Billion USD traded in 15 minutes.

These above normal volume candles catch my eye and make me wonder where are we going to go from here. If you have followed my journey you know that I now more than every I pay attention to the volume, especially from the dark pool.
Well this was the first sign for me to keep my eyes peel. So I put on my inspector glasses on to find more abnormal volume candlesticks.
Fear could be present in the market
Sure enough after doing a bit more research I discovered another above normal volume candlestick on VXX or fear ETF. And it wasnt a small amount. On Tuesday Jan 14th we had a 5.2 million Candlestick on VXX at 1:30 pm with the price range of 13.53-13.84

In seeing fear and big prints timing together it makes me think a big position is being placed by the big guys. So I kept my eyes out for more price action today the 21st of January.
More Above Average Volume in the Market
That’s right one week after that 5.2 million candlestick on the VXX we have two more today January 21st, 2020. Today we had a bunch of 1 million candlesticks on the 5 min chart and the 3rd chart is the daily chart with increasing volume of 40.85 million in total today. On Friday we had 33 million shares traded. Today we also seemed to have bounced up off the bottom of VXX.
Will this be a repeat of October 2018?
Is this the beginning of the recession 2020?
We shall see. Here are more big volume candles on the indexes today and this could be the market repositioning. There was 7 million on the SPY after the 36 million on Friday 331.14-331.37 for the DIA or the Dow Jones ETF there were two bigger than normal candlesticks one at 9:35am and one at 1:55pm. for 400K 292.78-293.10 and 650K 291.65-292.06.
Are all these higher than normal candlesticks the top for us? Looking at these charts when we see the DIA drop below 291.5 and SPY below 331 and VXX above 13.85 we will likely see the market drop in value. It wouldn’t be suprising to see a bit of a pullback as the SPY has been climbing up and up and up since 12/03/19. We might see a test of 324.5 and then 317.50.
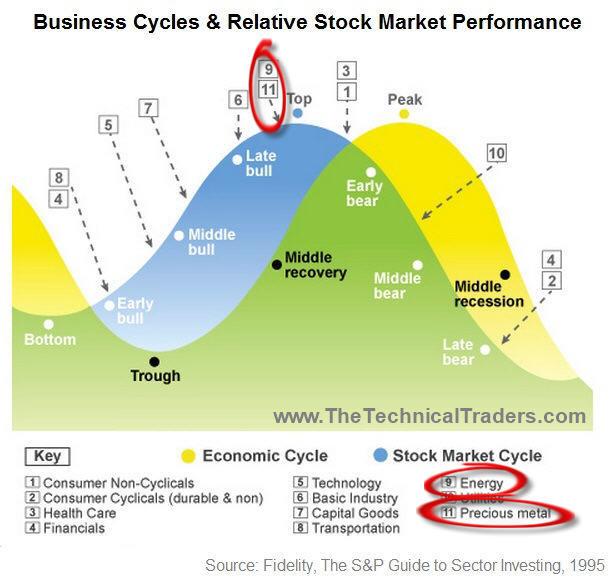
Where is the money going?

Looking at this chart maybe they are putting their money into precious metals and Energy sector? Either way I’m ready as I watching for these high volume candlesticks.
Let me know your thoughts in the comments below.
I love hearing feedback, so please share. You can also contact me on my social media accounts Twitter (@ItsAirplaneJane), Instagram (missairplanejane), LinkedIn and Facebook (@sugarairplanejane) or YouTube
The tool I use for scanning and alerting is Trade Ideas who offer an always free trading room. You can receive 5% off with Promo code CARPEPROFIT15 all caps when you sign up here for your first year or month
Trade Ideas will be offering the quarterly full access test drive of their software their software in Nov 2019 for the cost of data fees $9.
Another amazing software is Trendspider that has a new innovative rain drop candlestick that shows the volume for the morning session and afternoon session as far as the weight of it in price action. You can try them for free for 7 days here and receive 20% off with MTS20
My book is available at Amazon FMJ Trust Transition Trade: How Successful Traders Said It, Did It, and Lived It . As well as Barnes and Noble, Indigo, Chapters,and more.
For my charts I use Tradingview which offer free charting and paid services.
Also Stocks To Trade that has a 2 week $7 trial
This blog is for informational and educational purposes. I am not a registered securities broker-dealer or an investment adviser. The information here is not intended as securities brokerage, investment or as an offer or solicitation of an offer to sell or buy, or as an endorsement, recommendation or sponsorship of any security or fund.


I like this web blog very much, Its a really nice billet to read and obtain info .
My brother saved this web site for me and I have been going through it for the past several hrs. This is really going to assist me and my friends for our class project. By the way, I like the way you write.
This is such a fantastic resource that youre offering and also you give it absent free of charge. I adore seeing web websites that comprehend the value of providing a quality resource free of charge. It?s the outdated what goes about arrives around routine.