Many people become accustomed to the same platform and same information to analyze their stock charts on a daily basis. As with technology and the movement of algorithms, comes development of some amazing new products.

Innovations of Technology
Trendspider is a newer player in the world of Fintech with the latest in charting technology and they are advancing quickly.
The concept of Trendspider began back in 2016 when Dan and Rus the founding partners set out to build a new type of charting platform. A platform that you help you to make more profits and simplify your analysis.
The is the latest and greatest now in charting technology to help a trader with a plan succeed with more profits and fewererrors. Their alerts are “head and shoulders” above the rest as they state right on their site.
The company is global with people working around the world in Chicago, Denver, India, Russia, and Ukraine. As of September 2019 they presently have over 4000 traders using and helping to improve the software with feedback.
A newbie in the fintech world, but as you read the pros and cons below you will quickly understand how they are here to stay and thrive all while helping traders along the way.
When you are a trader it is important to understand the overall trend of the stock in the big picture to know if you are going with the masses or trying to stand out and be different and go against the trend.
Trend Analysis
I am one that is definitely a non-conformist in life, but in trading being a conformist with the trend is a benefit. Riding that trend until the chart tells you otherwise is a smart idea.
The Automated Trendlines that are drawn by Trendspider are a life changer especially for a newbie trader that might not have any clue about how to draw the trendlines.
Not only does the software draw the trendlines for you, it allows you to spend more time analyzing instead of spending time doing the work of drawing the trendlines.
Candlesticks | Raindrops
You might be saying to yourself did she make a mistake typing Candlesticks and Raindrops. Nope there is no mistake there.
Trendspider has developed a proprietary candlestick that incorporates the volume into each candlestick. It is a way of being able to see how the volume affected that particular candle.
You can see this can help to capture the order flow in each individual candle. The Neutral raindrop (blue or purple candle)can sometimes help to point out the reversal point.

Trading Multiple Time Frames
If you have ever spoken to a trader that has been in the trading world for a while they will almost always advise you to look at a stock on multiple time frames before you make your ultimate decision to place that trade.
Well this is another point the Trendspider has gone above and beyond. They have a special feature that you can turn on and off where you can overlay the trendlines and indicators on one chart.
It’s literally mind blowing that no one created this sooner. I mean when you are trading don’t you want to have your moving averages from the daily chart on your 5-min chart.
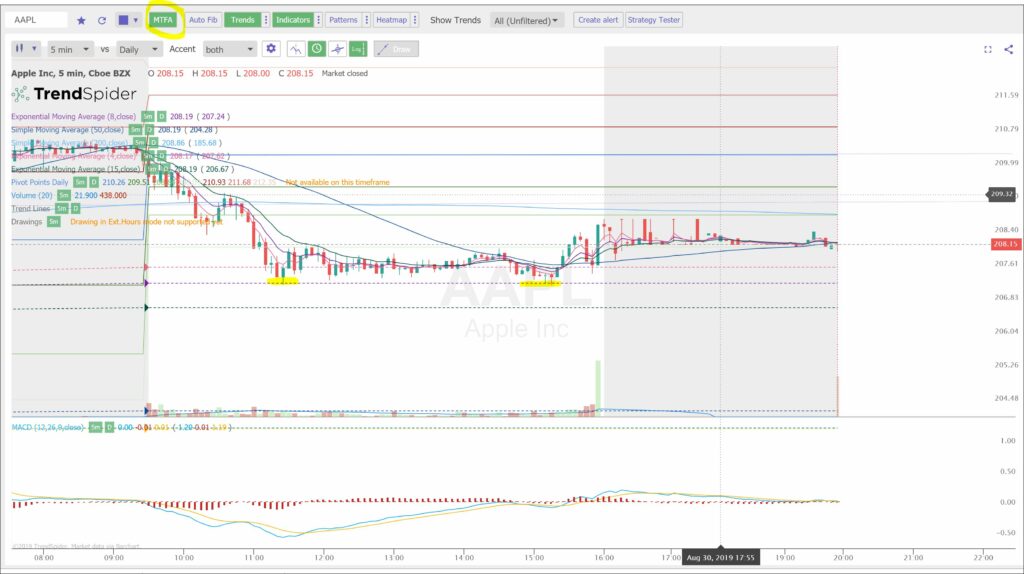
You can see on the chart the MTFA that is circled in yellow that is the toggle on off area. You can also see on this 5 minute chart how the double bottom that was created happens to be the 8 ema on the daily and that is right where the price action stopped.
Do you think it is a coincidence that the price action stopped right there or that there might be computer programs set up to buy there. The more you see this happen in time you begin to trust the indicators that you use.
It is tough to see the MACD as well has the overlay of the daily MACD on top of the 5 min chart. I know some people choose to have the Daily RSI versus 5 min RSI as well as indicators for potential entry.
Now lets touch on the areas that could use more innovation. I have no doubt the partners will likely read this review and see that there are other areas of expansion for the future that might make it to the update list.
The Risk Management Plan
One Tool that is great for traders is the ability to calculate risk before entry. Having the ability to calcuate risk is invaluable for entry and exit points
I’m sure that this is likely coming where you might be able to draw on the chart and have a box pop up to enter the amount of the risk if it goes against you and the profit potential and have that plot on the chart.
It would also be good if this could lock as to the day you enter to track you trade visually and show the profit that you were able to lock and share to fellow traders.

Order Book
Being able to see the order book where the orders are stacked up also helps to innovate the tool as a one stop shop for a trader that might want to see the bids and asks.
Even to be able to have an add on of the different ECN books for a surcharge. The data is coming in and potentially there for the trader to use as well but only if they want it in depth.

Stock News
We know that the market will usually have the positioning happen before the news is released, but it is still nice to have the ability to access the news.
Maybe the ability to link to the website of your choice Yahoo Finance, CNBC, CNN or another news service to see what is happening especially if there is a large intraday move.
The Different Trendspider Subscriptions
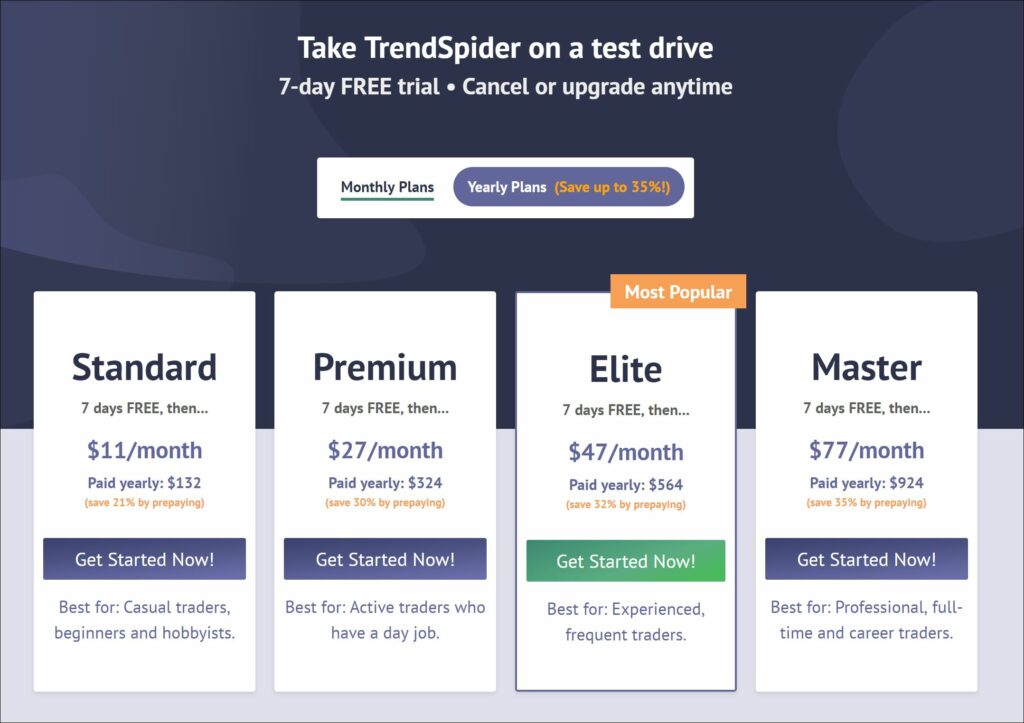
Trendspider Plans 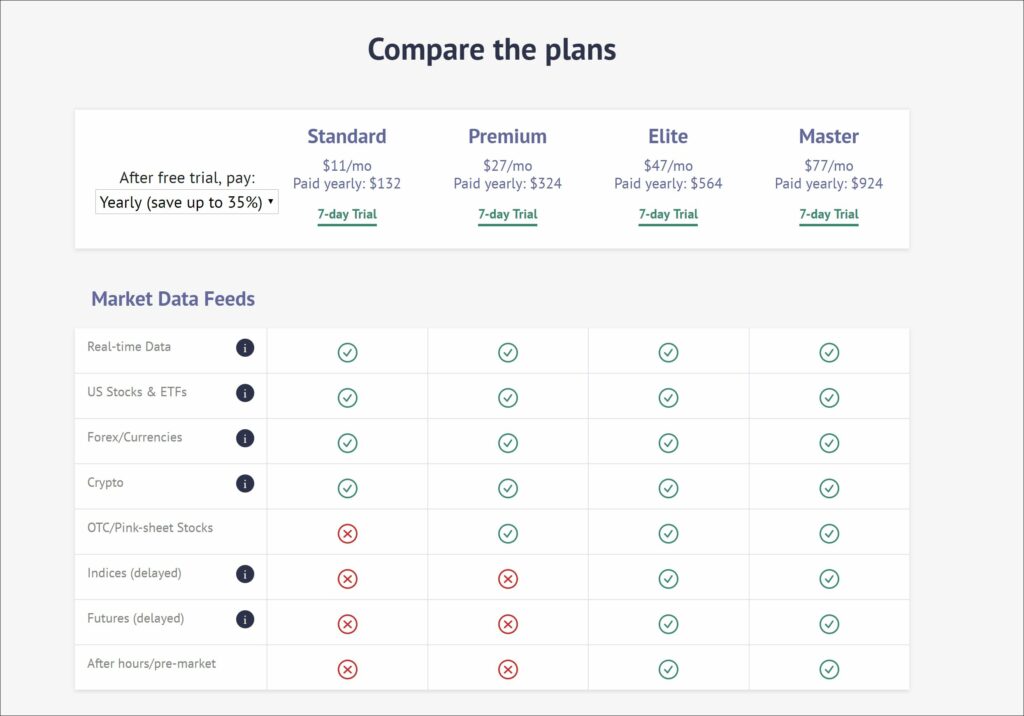
Trendspider Compare Plans 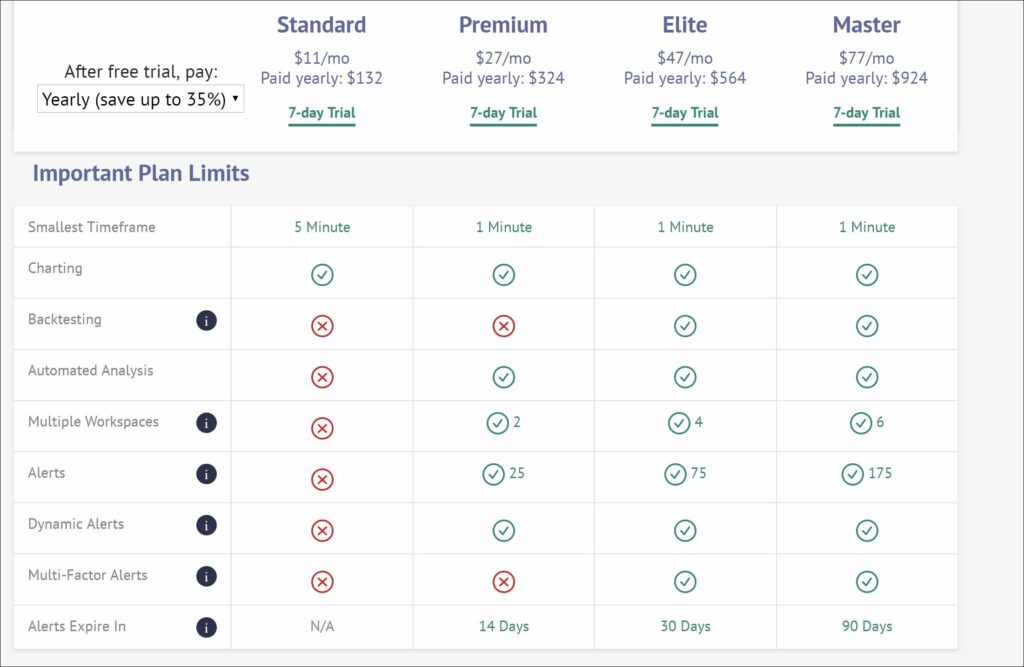
Trendspider Plan Limits 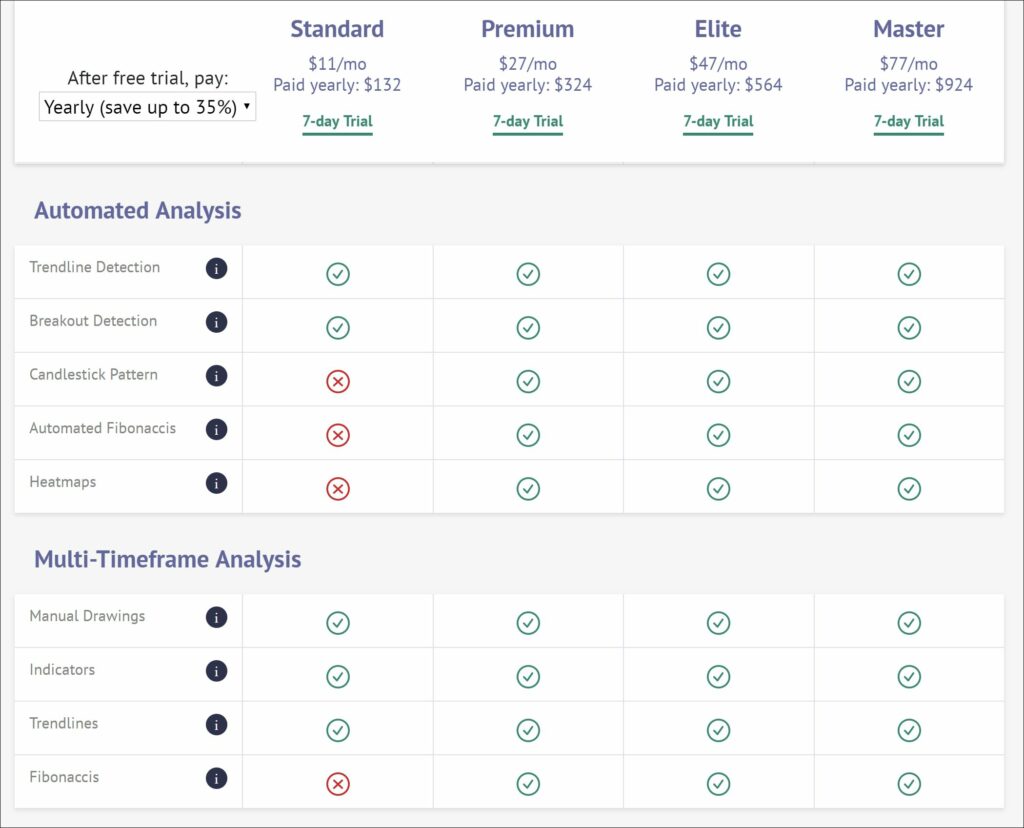
Trendspider Analysis 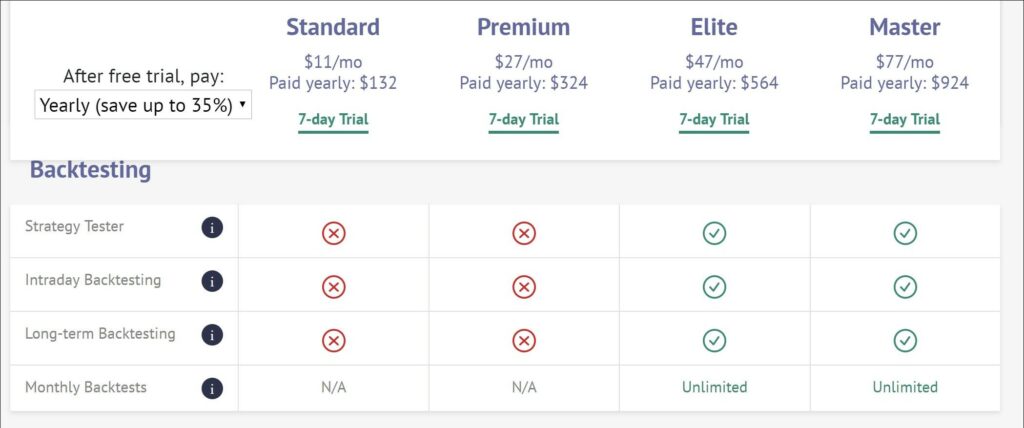
Trendspider Backtesting 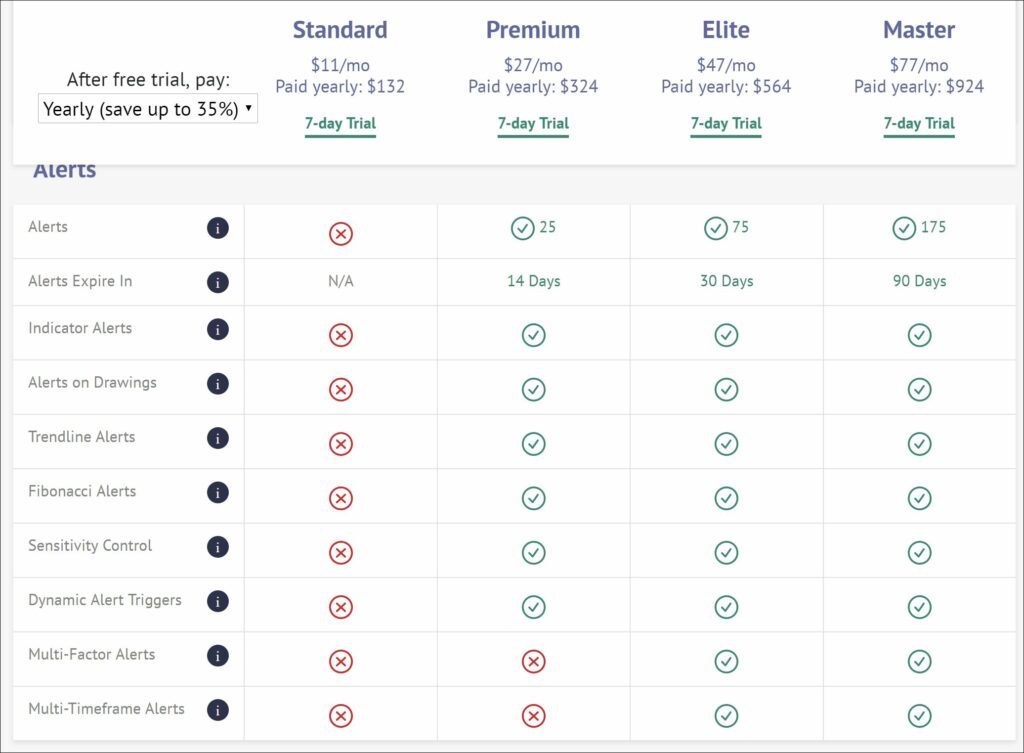
Trendspider Alerts 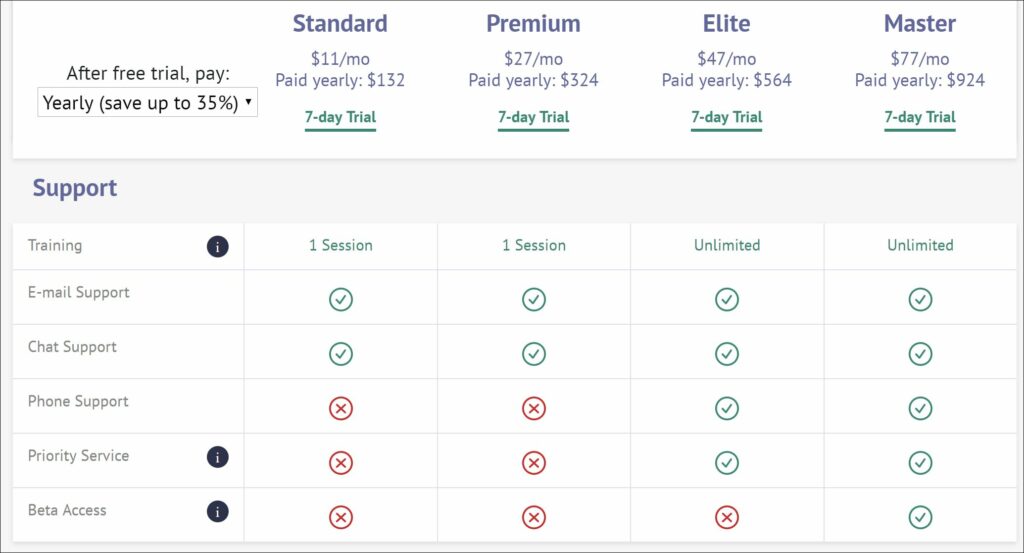
Trendspider Alerts
Trendspider is definitely the latest innovator in the trading world. If you know of new software that you find useful please let me know as I would love to try out the latest and greatest as well.
As of August 2019 I have partnered as an educator in The Training Pit that was created to help people learn from zero knowledge or to reset your training.
I hope this post has helped you learn a bit more about the Trendspider software. As you can tell, I find that helping people is very fulfilling and the whole reason why this blog began in 2015. If there is something that you would like me to cover please leave in the comments below.
I love hearing feedback from you. It makes my trading more personal and I like to hear how I can help you. If you would like to be in Training Pit with me sign up here or if you want one on one training you can email me jane@thedarkpools.com You can contact me here or Twitter (@ItsAirplaneJane), Instagram (missairplanejane), LinkedIn and Facebook (@sugarairplanejane) or YouTube
The tool I use for scanning and alerting is Trade Ideas who offer an always free trading room. You can receive 5% off with Promo code CARPEPROFIT15 all caps when you sign up here for your first year or month
Trade Ideas will be offering the quarterly full access test drive of their software their software in Nov 2019 for the cost of data fees $9.
Another amazing software is Trendspider that has a new innovative rain drop candlestick that shows the volume for the morning session and afternoon session as far as the weight of it in price action. You can try them for free for 7 days here and receive 20% off with MTS20
My book is available at Amazon FMJ Trust Transition Trade: How Successful Traders Said It, Did It, and Lived It . As well as Barnes and Noble, Indigo, Chapters,and more.
For my charts I use tradingview.com which offer free charting and paid services.
Also Stocks To Trade that has a 2 week $7 trial
This blog is for informational and educational purposes. I am not a registered securities broker-dealer or an investment adviser. The information here is not intended as securities brokerage, investment or as an offer or solicitation of an offer to sell or buy, or as an endorsement, recommendation or sponsorship of any security or fund.

